
Europe’s debt isn’t exploding — but something feels different in 2026
There’s no sudden debt crisis in Europe. But if you look closely, the direction is shifting. And that shift could matter more than the actual numbers.
Read analysis →Data-backed articles, explainers and updates on government debt, debt-to-GDP, country risk and fiscal pressure across the EU-27.

Europe’s public debt is not spread evenly. This data-backed analysis explains why total debt and debt-to-GDP tell two different stories about fiscal pressure in the EU.
Read analysis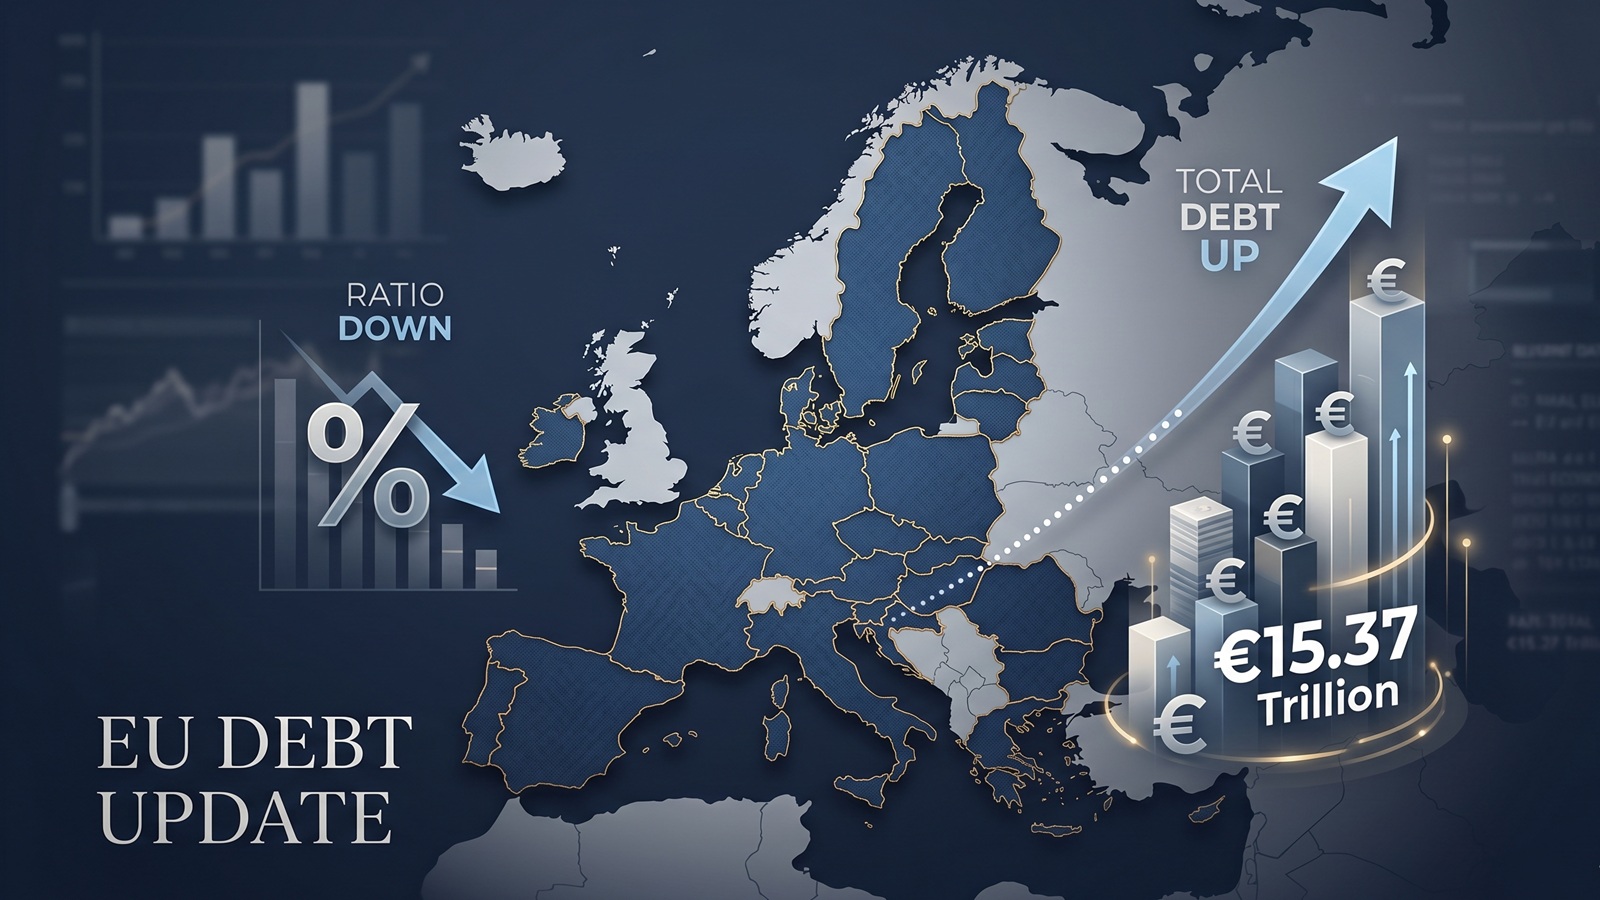
The latest Eurostat release offers a picture that looks calmer than it really is. The EU debt ratio edged down in late 2025, but the total stock of government debt still rose to more than €15.37tn.

Add together the public debt of all 27 EU countries and the total comes to more than €15 trillion. That number is useful, especially on a live map, but it can also mislead because Europe does not borrow like a single country.
Follow the main themes behind Europe’s debt story, from country rankings to fiscal rules and Eurostat data releases.
Read the newest EU Debt Map stories, explainers and data-backed analysis.
There’s no sudden debt crisis in Europe. But if you look closely, the direction is shifting. And that shift could matter more than the actual numbers.
Read analysis →
As the Greenback stumbles, the Euro is gaining ground. While tourists cheer, Brussels holds its breath. We analyze how the shifting FX landscape threatens to rewrite the map of European sovereign debt.
Read analysis →
New 2026 projections reveal a massive financial divide. While a Dutch citizen needs 9 months of work to pay off their share of the national debt, an Italian needs over 2 years.
Read analysis →
As 2026 begins, Europe faces a paralyzing paradox: the geopolitical imperative to rearm meets the rigid reality of reinstated fiscal rules.
Read analysis →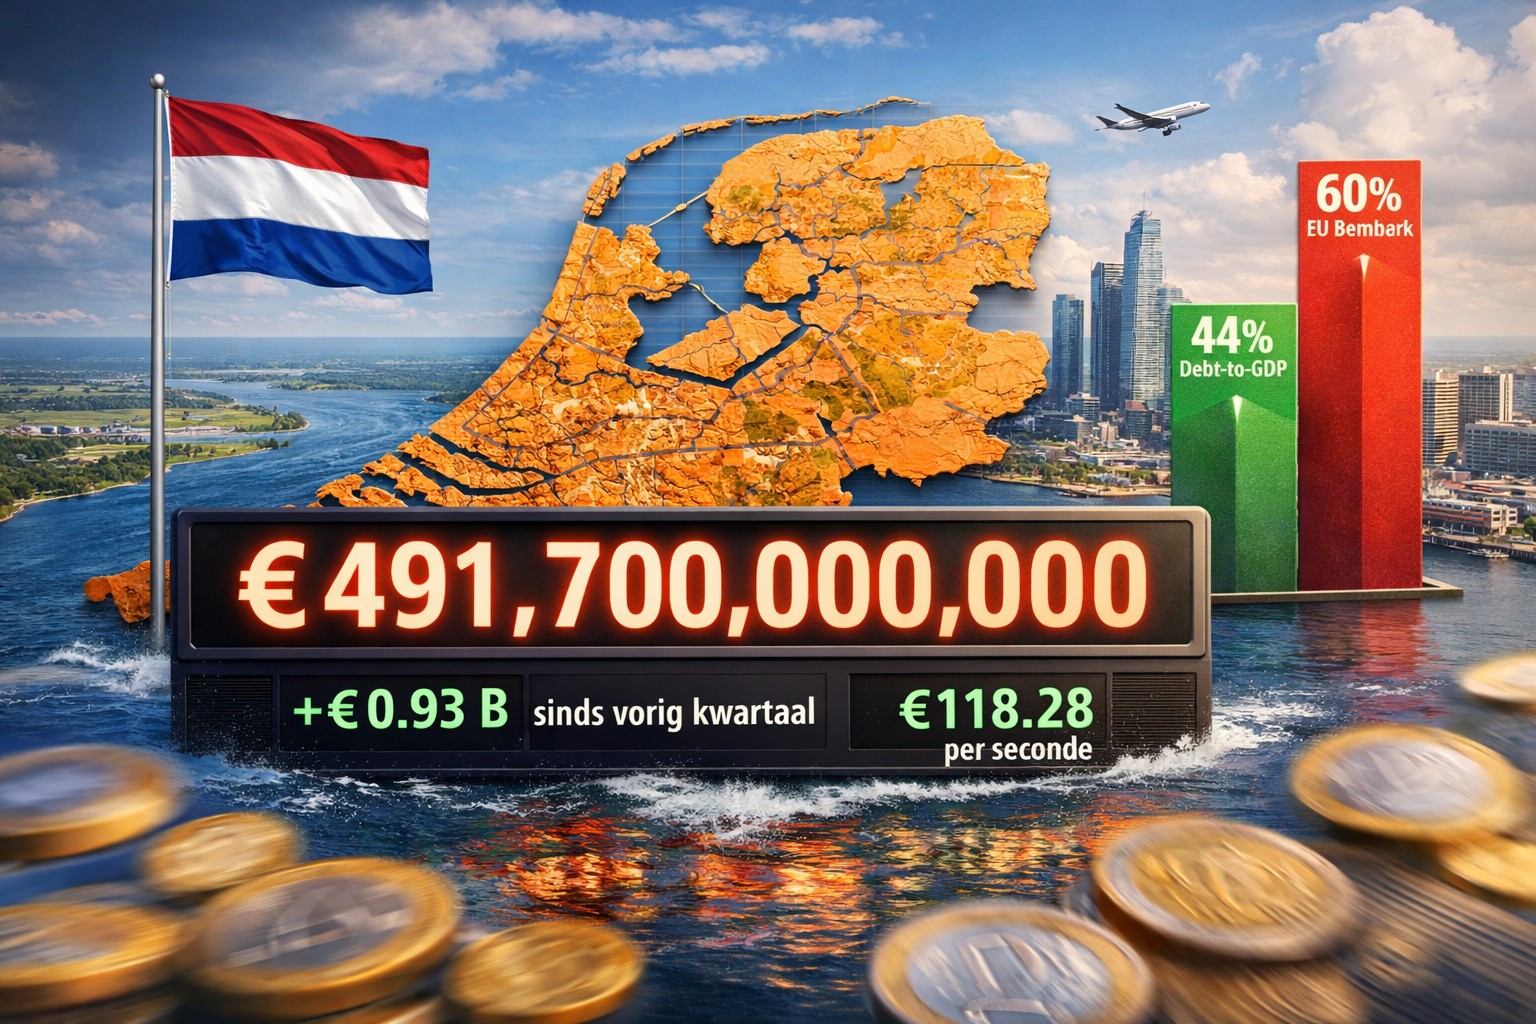
EU Debt Map visualizes the Netherlands’ public debt as a real-time estimate derived from Eurostat. This article explains what the live number, the €-per-second pace, and the debt-to-GDP context mean—and how to interpret them responsibly.
Read analysis →
Forget the Debt-to-GDP ratio for a moment. When we look at the raw debt burden per citizen, a new and surprising map of Europe emerges. We rank the EU-27 by debt per capita.
Read analysis →
Several EU countries are already above 100% debt-to-GDP, just like the United States. Yet markets treat US debt very differently. This article explains why.
Read analysis →
As Europe faces the colossal costs of the green and digital transitions, the old rules of austerity are being challenged by a new logic: borrowing not for consumption, but for survival and future growth.
Read analysis →
In an EU where most national debts are rising, Sweden is doing the opposite. With a debt ratio of just 34% and a declining counter, we look at how the 'top of the class' manages this outside the Eurozone.
Read analysis →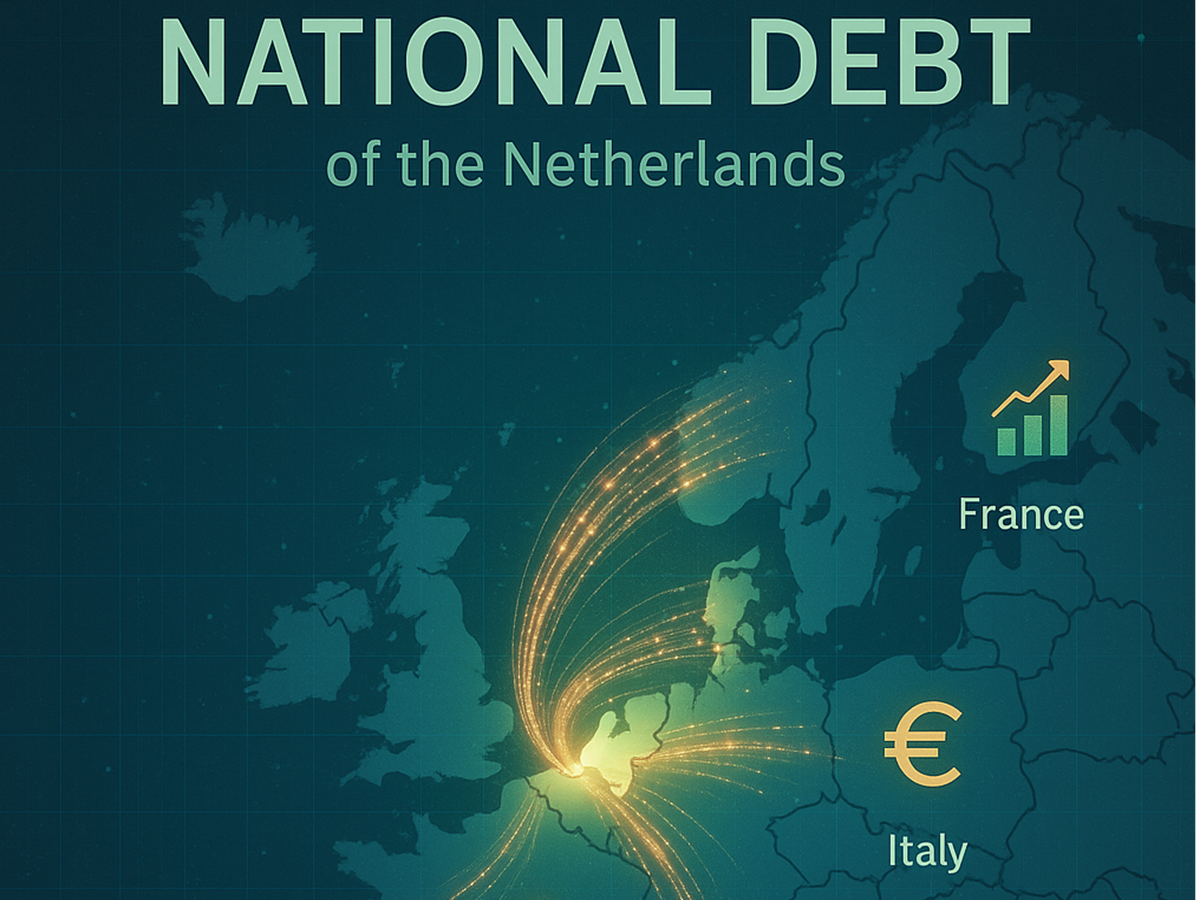
The Dutch national debt is rising by €118 every second. While its 42.7% debt-to-GDP ratio remains well below the EU limit, this live tracker reveals a more complex picture compared to its European neighbors.
Read analysis →
New Eurostat data for Q2 2025 reveals a Europe moving in two directions: while some countries’ debt-to-GDP ratios climbed, others managed to bring them down. Here’s what’s driving the shift beneath the surface.
Read analysis →
As interest rates rise, governments face a new reality. The question is no longer if debt becomes a problem, but when.
Read analysis →Some pages are deeper research views rather than normal articles. Use these when you want charts, rankings and methodology instead of a short editorial story.
EU Debt Insights is the editorial section of EU Debt Map. It explains public debt, debt-to-GDP, fiscal rules and country-level debt trends using transparent Eurostat data and EU Debt Map calculations. For the live overview, start with the interactive EU debt map. For calculation details, read our methodology.