Europe’s Hidden Burden: In Some Countries, National Debt Tops €50,000 per Citizen
By the EU Debt Map editorial team
Last updated: October 20, 2025
When national debt becomes personal
Across Europe, public debt is usually discussed in the language of billions — or as neat percentages of GDP. But what if those vast numbers were divided evenly among the people? According to fresh Eurostat data, citizens in several EU member states would each owe more than €50,000 if government debt were shared equally.
The limits of the debt-to-GDP ratio
The debt-to-GDP ratio remains the standard shorthand for fiscal health. It compares a country’s total debt to the size of its economy, offering clues about its ability to pay it back. Yet it also flattens human reality into abstract percentages. A nation can appear stable on paper while its citizens shoulder enormous obligations in real terms.
In early 2025, Eurostat’s figures still ranked Greece, Italy and France near the top in debt-to-GDP, while Estonia, Luxembourg and Ireland sat comfortably lower. But the story shifts dramatically when viewed through a different lens — debt per person.
The numbers behind the people
Dividing national debt by population uncovers a more intimate measure of a country’s fiscal load — one that can surprise even the most disciplined economies.
Top 5 EU countries by debt per person (Q1 2025):
- Belgium — €52,952 per person
- Italy — €49,139 per person
- France — €46,545 per person
- Austria — €42,679 per person
- Finland — €42,234 per person
Here, Belgium and Austria climb higher than expected, while ‘safe haven’ economies such as Ireland and Luxembourg also appear heavier than their modest population sizes might suggest. Wealth, it seems, does not always shield a country from large nominal debts.
Two Europes: visible and hidden risk
Looking closer, Europe’s debt landscape splits into two profiles:
- Solvency-pressure economies: Nations such as Greece and Portugal, where high debt-to-GDP ratios make them vulnerable to growth shocks.
- Hidden-burden economies: Wealthier countries like Ireland, Austria and the Netherlands, where debts appear manageable as a share of GDP — but loom large when measured per person.
As populations age and interest rates remain elevated, those hidden burdens could quietly grow, even without the drama of a debt crisis.
Why this matters
Debt per person transforms public finance from an abstract spreadsheet into a human reality. It reframes national borrowing not just as a macroeconomic metric, but as a generational responsibility. Every bond issued today will, in some form, be carried by tomorrow’s taxpayers.
In the end, both measures matter:
- Debt-to-GDP reveals short-term stability and market confidence.
- Debt per person captures the longer shadow — the scale of what citizens ultimately owe.
Explore the data
See how your country compares on the interactive EU Debt Map, which updates live with new Eurostat releases.
About the author
EU Debt Map Editorial Team
About us · firenature23@gmail.com
Sources: Eurostat government-debt data (Q1 2025) and population statistics as of January 1, 2025.
Further Reading
Analysis and data you might have missed

Europe’s Debt Burden in 2026: Which EU Countries Are Under the Most Pressure?
Europe’s public debt is not spread evenly. This data-backed analysis explains why total debt and debt-to-GDP tell two different stories about fiscal pressure in the EU.
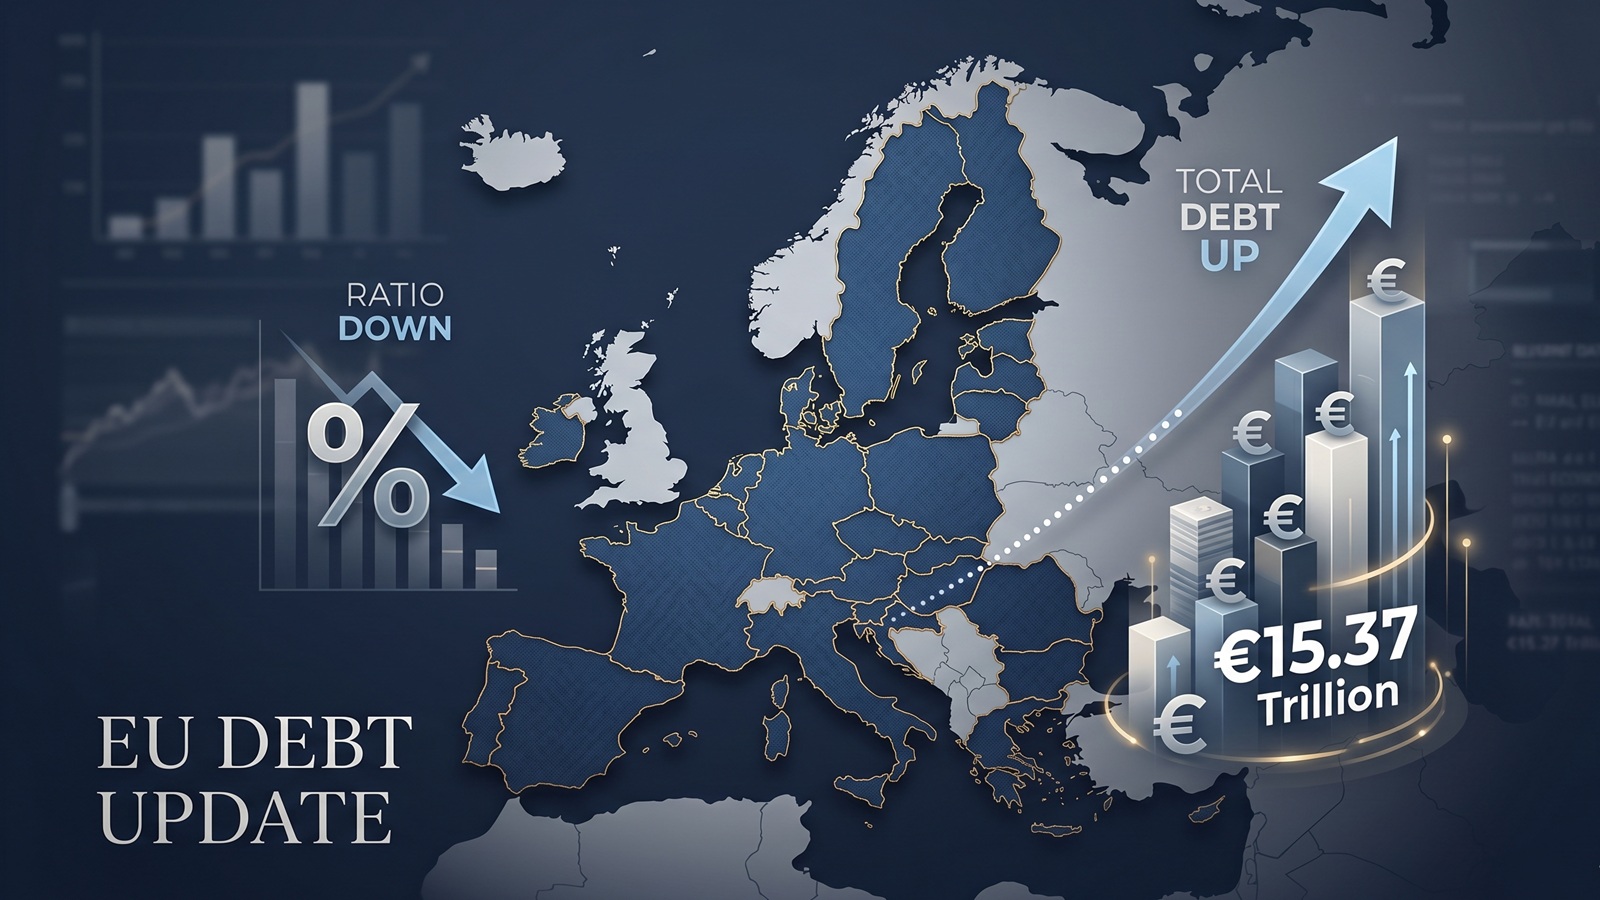
EU debt update: the ratio fell, but the pile still grew to €15.37tn
The latest Eurostat release offers a picture that looks calmer than it really is. The EU debt ratio edged down in late 2025, but the total stock of government debt still rose to more than €15.37tn.

EU Debt Explained: Why Adding It All Up Helps, and Misleads
Add together the public debt of all 27 EU countries and the total comes to more than €15 trillion. That number is useful, especially on a live map, but it can also mislead because Europe does not borrow like a single country.

Europe’s debt isn’t exploding — but something feels different in 2026
There’s no sudden debt crisis in Europe. But if you look closely, the direction is shifting. And that shift could matter more than the actual numbers.

The Dollar Dives, The Euro Thrives: A Silent Crisis for Europe's Debt Mountain?
As the Greenback stumbles, the Euro is gaining ground. While tourists cheer, Brussels holds its breath. We analyze how the shifting FX landscape threatens to rewrite the map of European sovereign debt.

Born with a €58,000 Mortgage? The 2026 Debt-per-Capita Map of Europe
New 2026 projections reveal a massive financial divide. While a Dutch citizen needs 9 months of work to pay off their share of the national debt, an Italian needs over 2 years.