Germany’s Debt Paradox: How Fiscal Discipline Became an Economic Trap
By the EU Debt Map editorial team
Last updated: October 20, 2025
The illusion of strength
Germany’s public finances appear solid on paper. Its debt-to-GDP ratio has fallen for three consecutive years, landing at 62.5% by the end of 2024. Yet the country’s total public debt has actually reached a record €2.69 trillion. What looks like fiscal progress is, in reality, an optical illusion.
High inflation has swollen nominal GDP, shrinking the ratio without reducing the underlying debt. Economists call this inflationary deleveraging—a statistical trick that makes governments look healthier even as their budgets remain under strain. Germany’s apparent fiscal discipline is being propped up not by policy, but by prices.
Explore Germany’s debt in real time at EU Debt Map: Germany.
The constitutional straightjacket
At the heart of Germany’s financial debate lies a single phrase: die Schuldenbremse—the debt brake. Introduced into the constitution in 2009 and inspired by a post-war fear of inflation, the rule caps the federal government’s structural deficit at just 0.35% of GDP and forbids states from borrowing at all. For years, it was hailed as a symbol of prudence. Today, critics see it as a straitjacket.
That tension exploded in 2023, when the Constitutional Court blocked the government’s attempt to redirect €60 billion in unused COVID-19 funds toward climate and transformation projects. The verdict not only blew a hole in the federal budget—it exposed a deeper contradiction: Germany’s fiscal orthodoxy is colliding with its economic reality.
Investment hunger vs. fiscal restraint
Germany’s economy urgently needs massive investment—in energy transition, digital infrastructure, rail and road modernization, and defense. Yet within the narrow confines of the debt brake, financing those projects means either raising taxes or cutting social programs, both politically toxic options.
The IMF projects growth of just 0.2% for 2025, the lowest among advanced economies. The country’s export-driven model is faltering, and higher interest rates are making debt service more expensive. Meanwhile, the ECB’s withdrawal from quantitative easing means Berlin must now sell its bonds to private investors—who demand higher yields.
The political crossroads
In pure numbers, Germany’s €2.69 trillion debt is manageable for an economy of its size. The true challenge is political: choosing between a rigid interpretation of fiscal virtue and the flexibility required for renewal.
Many economists now warn that sticking to the debt brake risks a decade of underinvestment and slow decline—an outcome more dangerous to fiscal stability than temporary, targeted borrowing. The paradox is clear: a rule designed to protect the future may now be preventing it.
Explore Germany’s debt in real time at EU Debt Map: Germany.
About the author
EU Debt Map Editorial Team
About us · firenature23@gmail.com
Sources: Eurostat public-debt data (Q1 2025), German Finance Ministry reports, IMF World Economic Outlook, Bundesverfassungsgericht decision (2023).
Further Reading
Analysis and data you might have missed

Europe’s Debt Burden in 2026: Which EU Countries Are Under the Most Pressure?
Europe’s public debt is not spread evenly. This data-backed analysis explains why total debt and debt-to-GDP tell two different stories about fiscal pressure in the EU.
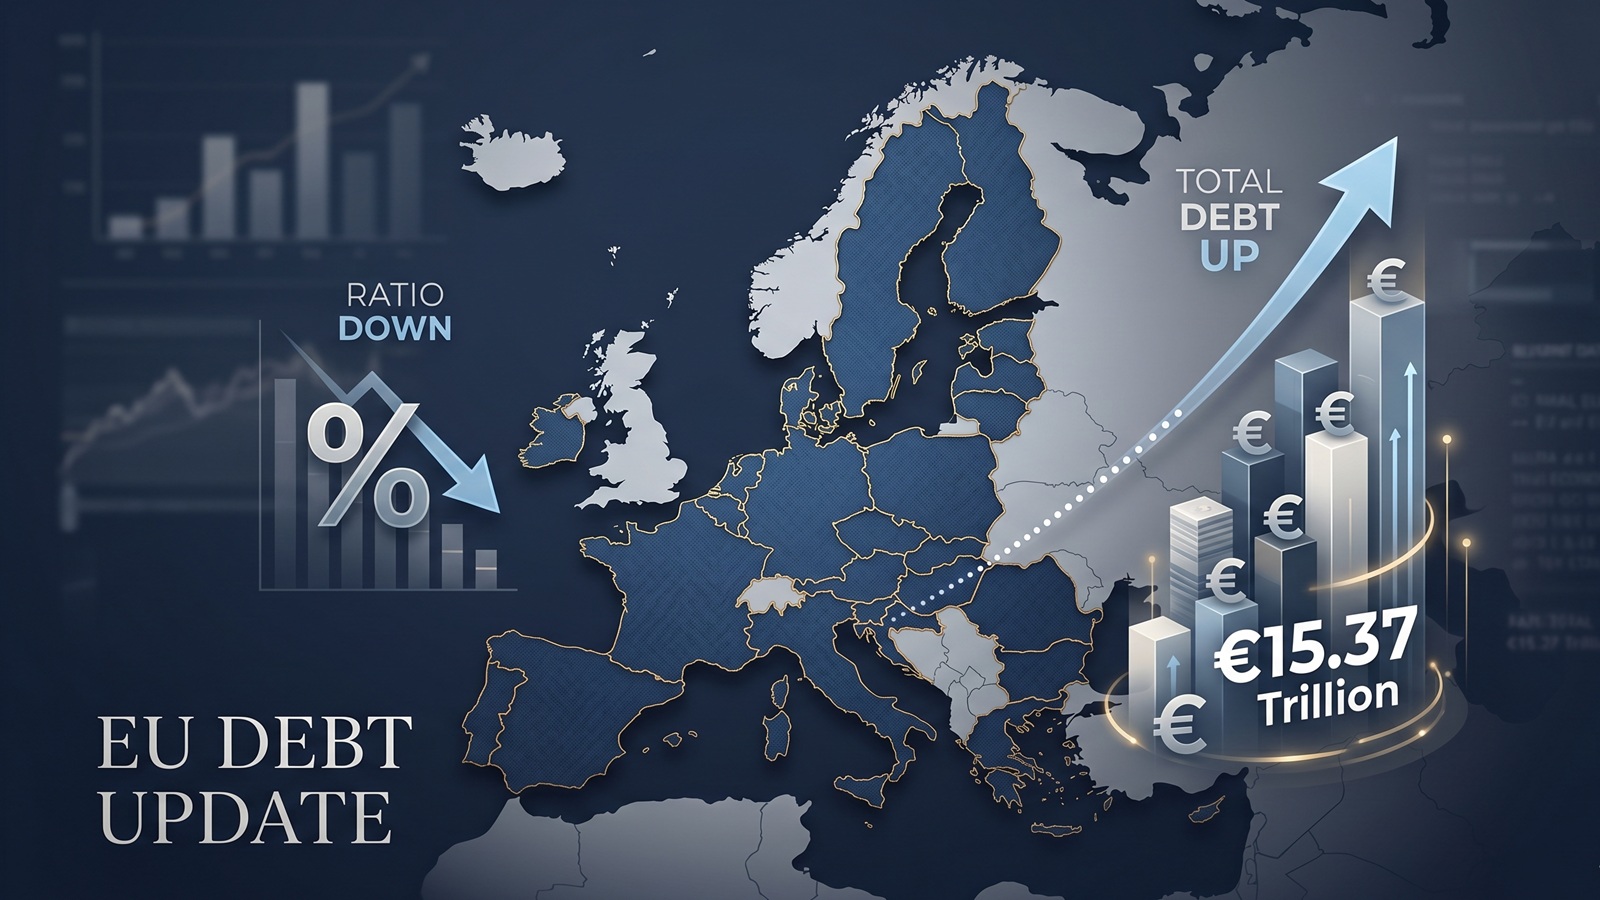
EU debt update: the ratio fell, but the pile still grew to €15.37tn
The latest Eurostat release offers a picture that looks calmer than it really is. The EU debt ratio edged down in late 2025, but the total stock of government debt still rose to more than €15.37tn.

EU Debt Explained: Why Adding It All Up Helps, and Misleads
Add together the public debt of all 27 EU countries and the total comes to more than €15 trillion. That number is useful, especially on a live map, but it can also mislead because Europe does not borrow like a single country.

Europe’s debt isn’t exploding — but something feels different in 2026
There’s no sudden debt crisis in Europe. But if you look closely, the direction is shifting. And that shift could matter more than the actual numbers.

The Dollar Dives, The Euro Thrives: A Silent Crisis for Europe's Debt Mountain?
As the Greenback stumbles, the Euro is gaining ground. While tourists cheer, Brussels holds its breath. We analyze how the shifting FX landscape threatens to rewrite the map of European sovereign debt.

Born with a €58,000 Mortgage? The 2026 Debt-per-Capita Map of Europe
New 2026 projections reveal a massive financial divide. While a Dutch citizen needs 9 months of work to pay off their share of the national debt, an Italian needs over 2 years.