Ranked: The European Countries Where Every Citizen Owes Over €50,000

The Invisible Price Tag
When economists talk about national debt, they usually speak in percentages. “Italy’s debt is 140% of GDP,” or “France has breached the 110% mark.” These numbers are abstract. They describe the health of the state, not the burden on the citizen.
But what if we took the colossal national debts of Europe and divided them equally among every man, woman, and child? The results paint a radically different picture of the European Union—one that places a surprisingly heavy price tag on citizens of countries often considered 'wealthy'.
Using live data projections and 2025 population demographics, we analyzed the Debt Per Capita across the EU-27. The results reveal a distinct '€50k Club'—countries where every newborn baby effectively starts life with a mortgage-sized share of public debt.
1. Belgium: The Surprise Leader (€56,885)
While the world looks at Italy or Greece, Belgium quietly takes the top spot for debt intensity per person among major EU economies. With a total national debt approaching €671 billion and a relatively small population of 11.8 million, the math is unforgiving.
Every Belgian citizen now carries a theoretical public debt burden of nearly €57,000. Unlike southern European countries, Belgium’s high personal wealth often masks this public liability, but the pressure on future fiscal budgets is undeniable.
2. Italy: The Heavyweight (€52,164)
It comes as no surprise that Italy is near the top. With a massive €3 trillion mountain of debt, the sheer scale of borrowing is hard to comprehend. However, because Italy has a larger population (almost 59 million) to shoulder this load, the per-capita figure is actually slightly lower than Belgium's.
Nevertheless, at over €52,000 per person, the burden remains critical. This figure explains why Italian bond yields are so sensitive to market changes; the load on each taxpayer is nearly at the breaking point.
3. France: The Fast Riser (€49,945)
France is currently the fastest-growing debtor in Europe in absolute terms. The French debt clock is ticking upwards at a rate that outpaces its neighbors. Currently hovering just under the €50k mark, France is likely to join the '€50k Club' before 2026.
The contrast with its neighbor, Germany, is stark. The average German carries 'only' roughly €32,000 of public debt—a difference of nearly €18,000 per citizen compared to the French.
The 'Frugal' East
On the other end of the spectrum, the map turns green. Eastern European and Baltic states continue to run remarkably lean operations. Estonia remains the EU’s poster child for fiscal discipline, with a debt per capita of just roughly €7,230. Bulgaria follows closely behind.
This divide creates a Europe of two speeds: the legacy economies of the West carrying heavy historical baggage, and the newer economies of the East traveling light.
Does It Matter?
Economists argue that public debt isn't like a credit card; it doesn't always need to be paid back to zero. However, the cost of that debt (interest payments) is paid by taxpayers. A higher debt per capita means a larger portion of your future taxes goes purely to servicing the interest on past spending, rather than funding schools, hospitals, or roads.
Want to see the live numbers for your country? Check our Live Debt Map Comparison.
Further Reading
Analysis and data you might have missed

Europe’s Debt Burden in 2026: Which EU Countries Are Under the Most Pressure?
Europe’s public debt is not spread evenly. This data-backed analysis explains why total debt and debt-to-GDP tell two different stories about fiscal pressure in the EU.
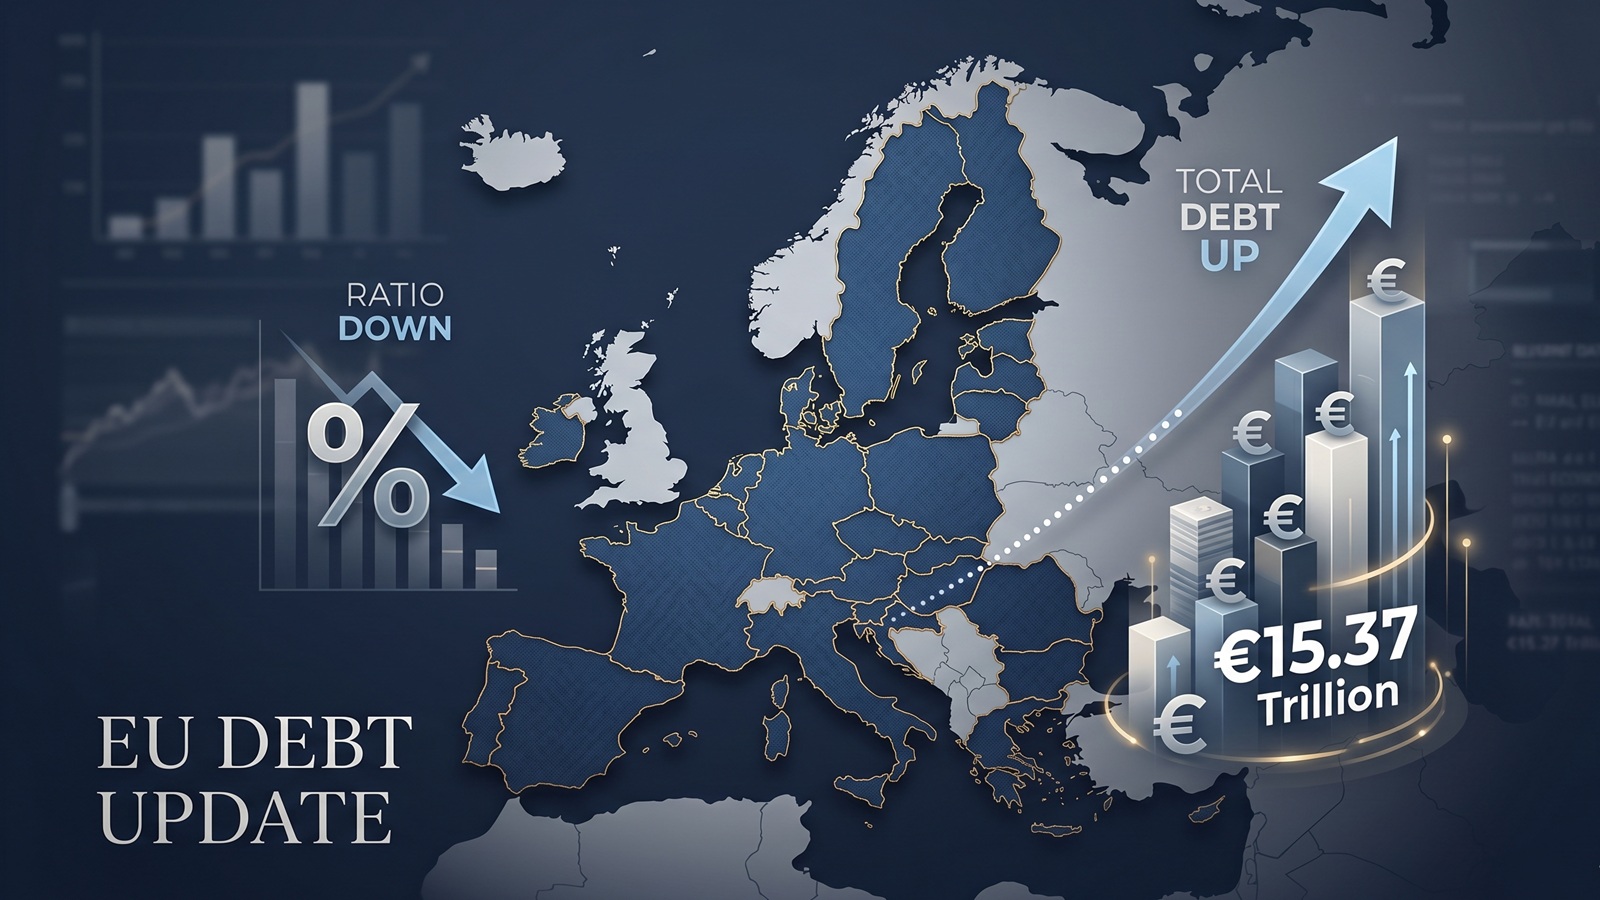
EU debt update: the ratio fell, but the pile still grew to €15.37tn
The latest Eurostat release offers a picture that looks calmer than it really is. The EU debt ratio edged down in late 2025, but the total stock of government debt still rose to more than €15.37tn.

EU Debt Explained: Why Adding It All Up Helps, and Misleads
Add together the public debt of all 27 EU countries and the total comes to more than €15 trillion. That number is useful, especially on a live map, but it can also mislead because Europe does not borrow like a single country.

Europe’s debt isn’t exploding — but something feels different in 2026
There’s no sudden debt crisis in Europe. But if you look closely, the direction is shifting. And that shift could matter more than the actual numbers.

The Dollar Dives, The Euro Thrives: A Silent Crisis for Europe's Debt Mountain?
As the Greenback stumbles, the Euro is gaining ground. While tourists cheer, Brussels holds its breath. We analyze how the shifting FX landscape threatens to rewrite the map of European sovereign debt.

Born with a €58,000 Mortgage? The 2026 Debt-per-Capita Map of Europe
New 2026 projections reveal a massive financial divide. While a Dutch citizen needs 9 months of work to pay off their share of the national debt, an Italian needs over 2 years.