Can the US Handle More Debt Than Europe?

At First Glance, the Numbers Look the Same
At the start of 2025, three EU economies sit clearly above the 100% debt-to-GDP mark: Greece, Italy and France. The United States is in the same zone, with public debt around 120% of GDP. On paper, Washington now belongs in the same club as Europe's most indebted member states.
If the ratios look similar, a simple question follows: why do many commentators argue that the US can sustain a much higher debt level than Europe before markets panic? And is that still true?
This article breaks down the core differences that matter for investors and policymakers, without falling for the myth of a single magical threshold.
The Dollar Advantage: Why the US Starts With Extra Credit
The first difference is simple and structural. The United States issues debt in its own currency, the US dollar. That currency is still the dominant unit for global trade, commodities and central bank reserves. As long as the world needs dollars, there is deep and constant demand for US Treasuries.
This global demand gives the US two advantages. It can run larger and longer deficits without immediately triggering a funding crisis. And it can always, in extremis, rely on its own central bank to stabilise markets in dollars. The main risk for the US is inflation, not technical default.
Most EU countries do not have that position. They borrow in a currency they do not control alone. That difference matters when stress hits.
Europe’s Built-In Vulnerability: One Currency, Many Governments
Members of the euro area share a currency but not a single fiscal authority. Athens, Rome and Paris cannot print euros at will. During the euro crisis this weakness became visible. Rising yields were not only about economic fundamentals, but also about fear that some countries might be forced out of the monetary union or face a rollover crisis.
Since then, the European Central Bank has built a stronger toolkit to prevent irrational market panics. Bond purchase programmes and new instruments are designed to contain extreme spreads. That has helped. Yet investors still know that each government is responsible for its own debt without full fiscal union behind it. The risk profile is different from a single federal issuer like the US Treasury.
Growth, Demographics and the Math Behind Sustainable Debt
Debt ratios do not move in isolation. What determines sustainability is the balance between three elements:
- the interest rate a country pays on its debt,
- the nominal growth rate of its economy,
- its primary budget balance, excluding interest costs.
If growth is stronger than the average interest rate, a country can stabilise or reduce a high debt ratio without brutal cuts. If growth is weak and interest costs rise, even a seemingly manageable ratio can become a slow-burning problem.
The United States benefits from a larger, more dynamic and younger economy. Innovation, productivity and demographics support its growth potential. Many EU countries face the opposite combination: aging populations, lower productivity growth and rising age-related spending. That makes every extra point of debt more sensitive.
Markets Are Rethinking Old Assumptions
For years, the narrative was simple: US debt is the global safe asset, Europe is fragile. The current picture is more nuanced. Some high-debt euro countries have extended maturities, improved their primary balances and implemented reforms. The EU has created joint instruments and clearer rules that make a sudden breakup less plausible than in 2012.
At the same time, investors are watching US politics with growing concern. Persistent large deficits in good times, repeated brinkmanship around the debt ceiling and inconsistent long-term planning have started to add a risk premium to US Treasuries. In recent data, long-term US yields have traded above those of several highly indebted euro area countries. That is not a sign of panic, but it is a sign that the old story of effortless US exceptionalism is no longer automatic.
No Magic Number, Only Country-Specific Reality
Past debates often tried to pin down a universal danger line: 90%, 100%, 120% of GDP. The evidence does not support a single fixed threshold. What matters more is the direction of travel and the institutional setup behind the numbers.
A country with high debt, credible institutions, solid growth and a clear plan can be safer than a country with lower debt but weak politics and no strategy. Recent upgrades for countries like Greece and Italy, and downgrades or warnings elsewhere, underline that markets judge behaviour and credibility, not just levels.
What This Means for Europe’s High-Debt Countries
For Europe, the message is uncomfortable but clear. Without stronger growth, demographic reform and targeted investment, high debt levels will slowly restrict room for action. Defence, climate, ageing and industrial policy all demand money. The new EU fiscal framework acknowledges this reality and links adjustment paths to reforms instead of rigid one-size-fits-all rules.
Success stories inside the euro area show that high debt is not automatically a death sentence. It becomes dangerous when politics blocks any credible path forward. The real risk is not the ratio today, but the absence of a believable story for tomorrow.
Check the Numbers for Yourself
If you want to see how your country compares in real time, explore our live overview of EU government debt ratios.
Further Reading
Analysis and data you might have missed

Europe’s Debt Burden in 2026: Which EU Countries Are Under the Most Pressure?
Europe’s public debt is not spread evenly. This data-backed analysis explains why total debt and debt-to-GDP tell two different stories about fiscal pressure in the EU.
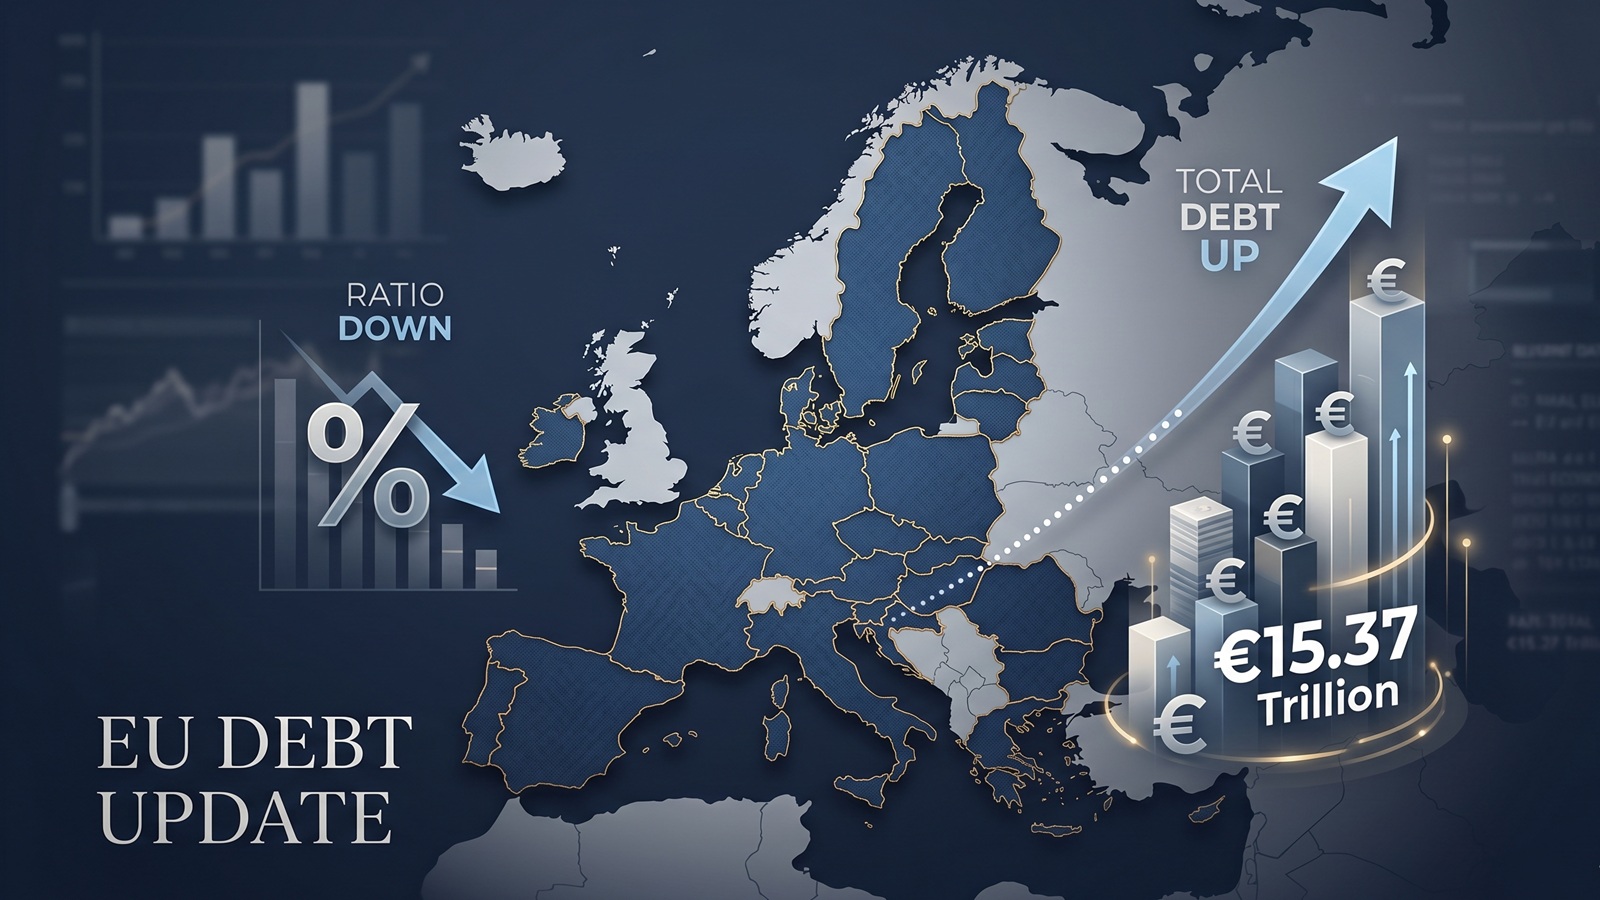
EU debt update: the ratio fell, but the pile still grew to €15.37tn
The latest Eurostat release offers a picture that looks calmer than it really is. The EU debt ratio edged down in late 2025, but the total stock of government debt still rose to more than €15.37tn.

EU Debt Explained: Why Adding It All Up Helps, and Misleads
Add together the public debt of all 27 EU countries and the total comes to more than €15 trillion. That number is useful, especially on a live map, but it can also mislead because Europe does not borrow like a single country.

Europe’s debt isn’t exploding — but something feels different in 2026
There’s no sudden debt crisis in Europe. But if you look closely, the direction is shifting. And that shift could matter more than the actual numbers.

The Dollar Dives, The Euro Thrives: A Silent Crisis for Europe's Debt Mountain?
As the Greenback stumbles, the Euro is gaining ground. While tourists cheer, Brussels holds its breath. We analyze how the shifting FX landscape threatens to rewrite the map of European sovereign debt.

Born with a €58,000 Mortgage? The 2026 Debt-per-Capita Map of Europe
New 2026 projections reveal a massive financial divide. While a Dutch citizen needs 9 months of work to pay off their share of the national debt, an Italian needs over 2 years.