Ticking Up by €118/Second: Is the Netherlands Still Europe's 'Frugal' Leader?
Why national debt matters
Public debt doesn’t only concern finance ministers. It shapes interest rates, inflation, and fiscal policy. Under the 1992 Maastricht Treaty, EU member states agreed to keep their annual deficits below 3% and their government debt below 60% of gross domestic product (GDP). These rules—codified in the Stability and Growth Pact—are meant to prevent today’s borrowing from becoming tomorrow’s crisis. Yet more than a third of EU countries now exceed the 60% debt threshold.
The Netherlands in context
The Netherlands is often cited as a fiscally disciplined country. At the end of 2023, government debt stood at €481 billion—about 45.1% of the nation’s economic output. This ratio had fallen to the lowest level in 15 years after pandemic-related borrowing. A year later, figures show that debt ticked up again: in the first half of 2025, total public debt rose to €492 billion. According to Statistics Netherlands (CBS) and Eurostat, this equals 42.7% of GDP as of June 2025. In other words, the Netherlands remains comfortably below the EU’s 60% ceiling and far below high-debt nations like France and Italy, where debt ratios exceed 100%.
A live window into Europe’s finances
The EU Debt Map transforms dry fiscal data into a living picture of Europe. The site uses each country’s most recent Eurostat figures as a baseline and projects them second by second to show how fast public debt grows—or occasionally shrinks. It is an independent, educational visualization, not an official statistic. With one glance you can compare France’s towering €3.42 trillion debt—rising by roughly €9,115 every second—with the more modest numbers of Estonia. The map also color-codes countries by whether their debt is rising (red) or falling (green) and links directly to each national ticker.
What the Netherlands ticker shows
On the Netherlands page, the Debt Map presents a live estimate of around €491.7 billion. The page reports how much the debt has changed since the previous quarter (+€930 million) and the approximate pace at which it rises: about €118 per second. These figures are derived by interpolating between the two latest Eurostat reference dates, producing a dynamic counter that reflects whether the Netherlands is moving closer to or further away from the 60% benchmark.
Explore the data for yourself
Numbers alone don’t tell the whole story. By clicking through to the debt page, you can see the debt ticking in real time, compare it with neighbouring countries, and appreciate the bigger picture. The visualization makes abstract fiscal data tangible and encourages informed debate about taxation, spending, and the sustainability of public finances. The EU Debt Map offers a new way to understand national debt—and the Netherlands’ place in Europe’s fiscal landscape.
Further Reading
Analysis and data you might have missed

Europe’s Debt Burden in 2026: Which EU Countries Are Under the Most Pressure?
Europe’s public debt is not spread evenly. This data-backed analysis explains why total debt and debt-to-GDP tell two different stories about fiscal pressure in the EU.
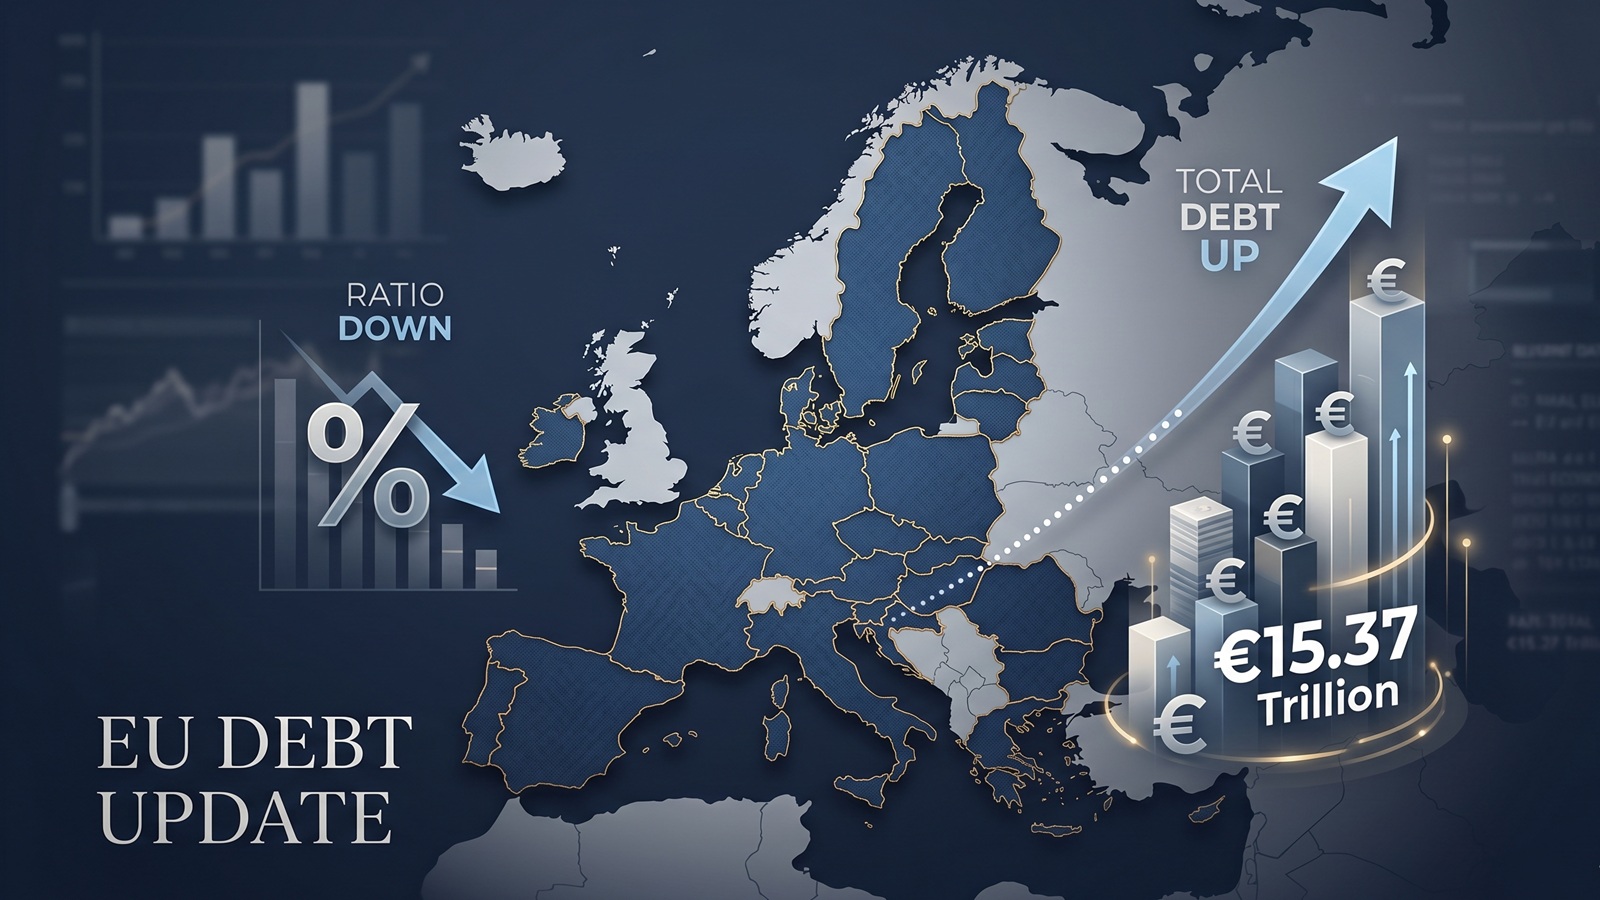
EU debt update: the ratio fell, but the pile still grew to €15.37tn
The latest Eurostat release offers a picture that looks calmer than it really is. The EU debt ratio edged down in late 2025, but the total stock of government debt still rose to more than €15.37tn.

EU Debt Explained: Why Adding It All Up Helps, and Misleads
Add together the public debt of all 27 EU countries and the total comes to more than €15 trillion. That number is useful, especially on a live map, but it can also mislead because Europe does not borrow like a single country.

Europe’s debt isn’t exploding — but something feels different in 2026
There’s no sudden debt crisis in Europe. But if you look closely, the direction is shifting. And that shift could matter more than the actual numbers.

The Dollar Dives, The Euro Thrives: A Silent Crisis for Europe's Debt Mountain?
As the Greenback stumbles, the Euro is gaining ground. While tourists cheer, Brussels holds its breath. We analyze how the shifting FX landscape threatens to rewrite the map of European sovereign debt.

Born with a €58,000 Mortgage? The 2026 Debt-per-Capita Map of Europe
New 2026 projections reveal a massive financial divide. While a Dutch citizen needs 9 months of work to pay off their share of the national debt, an Italian needs over 2 years.