The End of Free Money: Europe’s Silent Debt Crisis

Subtitle: As borrowing costs climb, European governments are forced to confront a new reality. The question is no longer whether debt is a problem, but when.
For the first time in over a decade, money has a price again — and that price is now painfully visible in the budget offices of Rome, Paris, and Brussels.
After years of ultra-low and even negative interest rates — a period when governments could borrow almost for free — the abrupt return of inflation and the European Central Bank’s (ECB) rate hikes have rewritten the rules of public finance.
Countries that once refinanced old loans effortlessly with cheap new ones are now facing a harsh reality: refinancing costs billions more. According to the OECD, nearly 40% of public debt in advanced economies must be refinanced before 2027 — at far higher rates than before. This is not an abstract risk; it is a growing budget line that diverts money away from healthcare, defense, and the green transition.
The “Club of 100 Percent”
Markets and the European Commission are closely watching what has come to be known as the “Club of 100 Percent” — countries whose public debt exceeds their annual economic output.
The 2024 figures are sobering. Greece still leads with a debt ratio of roughly 153%, but the real concern lies with larger economies: Italy (≈135%), France (≈113%), Spain (≈102%), and Belgium (≈105%).
These countries are trapped in a dangerous loop: high debt makes them vulnerable to rising rates, and rising rates make it harder to reduce debt. You can explore the full ranking of debt-to-GDP ratios to see how countries compare across Europe.
Brussels Tightens the Reins
The pandemic-era fiscal pause is over. With a (slightly) reformed Stability and Growth Pact back in force, Brussels is sending a clear message: deficits must come down. In mid-2024, the European Commission placed several countries — including France and Italy — under the excessive deficit procedure, effectively putting them on fiscal probation.
This creates both political and economic tension. For France, the eurozone’s second-largest economy, the push to cut spending is politically explosive. The friction between national sovereignty and EU fiscal discipline is back. On the interactive EU debt map, the rising debt of these nations offers a live reminder of the growing urgency.
A Global Headache
Europe’s debt dilemma is part of a broader global pattern. The International Monetary Fund (IMF) warns that worldwide public debt is on track to reach 100% of global GDP by 2029 — a level not seen since the aftermath of World War II.
The world’s two largest economies are driving the trend. The United States now carries debt exceeding 120% of GDP. China’s official debt, at around 88%, looks moderate — but its hidden local debt is estimated at an additional 148% of GDP, weighing heavily on the country’s fragile property market.
When the anchors of the global economy are this heavily indebted, the entire financial system becomes more fragile.
The Dutch Paradox
Amid this global tension, the Netherlands stands out as an exception — and a lesson in fiscal dynamics. In 2024, the Dutch government deficit widened, and nominal debt rose above €491 billion. Yet the country’s debt ratio fell to just 43.7% of GDP — well below the EU’s 60% threshold.
How is that possible? Because the Dutch economy grew faster than its debt. This underlines a key truth: the absolute size of a country’s debt matters less than its debt-to-GDP ratio, the measure of what a nation owes compared with what it produces. It’s also why the EU Debt Map focuses on these ratios rather than just raw totals.
For Italy and France, the lesson is clear: without growth — or with interest costs that choke growth — debt quickly becomes unsustainable. The silent crisis has already begun.
Further Reading
- What does debt-to-GDP really mean?
- All articles and analyses
- Interactive map with live debt data per country
Sources: European Commission, Eurostat, IMF, OECD, and national central banks. Figures refer to the latest available data for 2024–2025.
Further Reading
Analysis and data you might have missed

Europe’s Debt Burden in 2026: Which EU Countries Are Under the Most Pressure?
Europe’s public debt is not spread evenly. This data-backed analysis explains why total debt and debt-to-GDP tell two different stories about fiscal pressure in the EU.
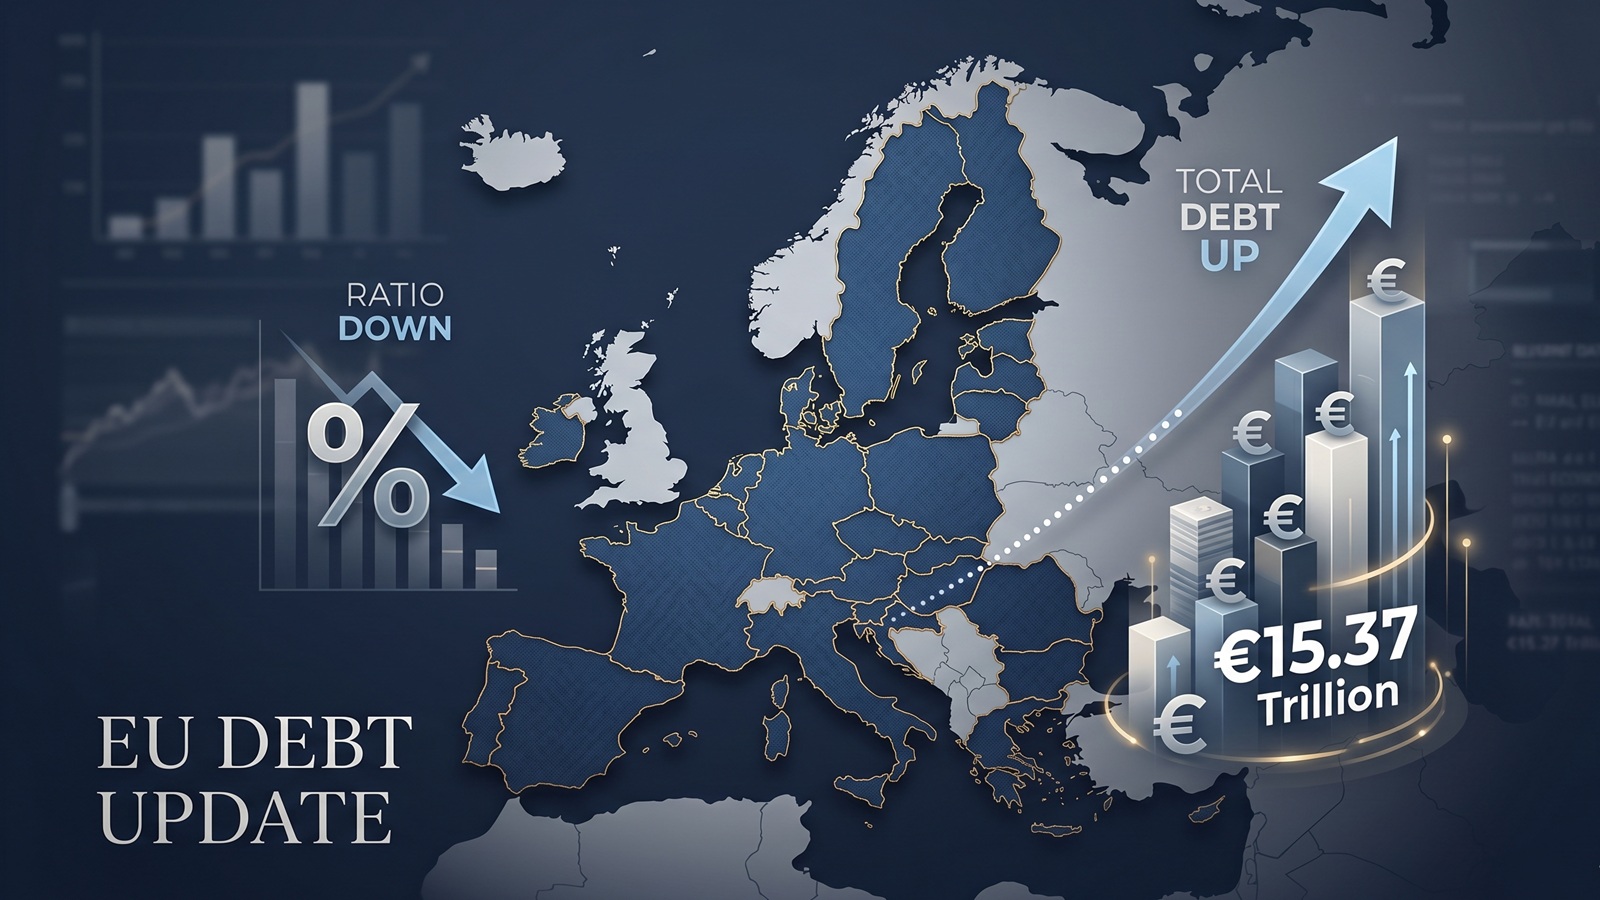
EU debt update: the ratio fell, but the pile still grew to €15.37tn
The latest Eurostat release offers a picture that looks calmer than it really is. The EU debt ratio edged down in late 2025, but the total stock of government debt still rose to more than €15.37tn.

EU Debt Explained: Why Adding It All Up Helps, and Misleads
Add together the public debt of all 27 EU countries and the total comes to more than €15 trillion. That number is useful, especially on a live map, but it can also mislead because Europe does not borrow like a single country.

Europe’s debt isn’t exploding — but something feels different in 2026
There’s no sudden debt crisis in Europe. But if you look closely, the direction is shifting. And that shift could matter more than the actual numbers.

The Dollar Dives, The Euro Thrives: A Silent Crisis for Europe's Debt Mountain?
As the Greenback stumbles, the Euro is gaining ground. While tourists cheer, Brussels holds its breath. We analyze how the shifting FX landscape threatens to rewrite the map of European sovereign debt.

Born with a €58,000 Mortgage? The 2026 Debt-per-Capita Map of Europe
New 2026 projections reveal a massive financial divide. While a Dutch citizen needs 9 months of work to pay off their share of the national debt, an Italian needs over 2 years.