Born with a €58,000 Mortgage? The 2026 Debt-per-Capita Map of Europe

The Hidden Bill: What You Really Owe in 2026
When politicians in Brussels talk about the economy, they use abstract terms like "Debt-to-GDP" or "Macro-economic consolidation." But these billions mean nothing to the average household. To understand the real financial health of Europe, we must ask a simpler question: If we split the national bill today, how much would every man, woman, and child have to pay?
Based on our latest analysis of Q3 2025 Eurostat data and 2026 projections, the answer reveals a shocking inequality. The "average" European doesn't exist. Instead, there is a deep divide between the North, the South, and the East.
The "Club of 50,000"
By 2026, three major EU nations will enter what we call the Club of 50,000. In these countries, every newborn baby starts life with a virtual debt of over €50k attached to their name.
- 🇧🇪 Belgium (€58,750): The unwanted leader. Due to structural deficits and automatic wage indexation, a Belgian family of four theoretically carries a public burden of nearly €235,000.
- 🇮🇹 Italy (€52,720): Italy faces a "demographic trap." While the debt grows due to interest rates, the population is shrinking, leaving fewer people to carry the load.
- 🇫🇷 France (€52,400): The fastest riser. France is rapidly catching up to Italy, with debt per capita expected to break the €52k barrier in 2026 driven by a high deficit.
The "Working Years" Metric: How Long Must You Work for the State?
A debt of €50,000 sounds manageable if you are rich, but crushing if you are not. To see the true burden, we compared the debt per capita against the average net annual income of a single worker in 2026.
The results are stark:
- 🇮🇹 The Italian Burden (2.15 Years): An average Italian worker would have to work more than two full years—spending absolutely nothing else—just to pay off their share of the state debt.
- 🇧🇪 The Belgian Wedge (1.81 Years): Despite high incomes, the debt load is so massive that it equals nearly two years of net salary.
- 🇳🇱 The Dutch Buffer (0.77 Years): In sharp contrast, a Dutch citizen could theoretically clear their public debt in less than 9 months of work.
This metric explains why fiscal policy feels so much tighter in the South: tax money is consumed by the past (interest), not the future.
The Irish Illusion & The Estonian Miracle
Traditional maps can be misleading. Take Ireland. On paper, their Debt-to-GDP ratio is excellent (approx 38%). But this is distorted by multinational accounting. When we look at the real debt per person, Ireland sits at a hefty €42,727—far higher than Germany or Spain.
On the other end of the spectrum lies Estonia. With a debt of just €8,695 per person, an Estonian carries 8 times less public debt than a Belgian. Even with rising defense spending, the Baltics remain the fiscally cleanest region in Europe.
The Rising Stars (In the Wrong Direction)
While the focus is often on the South, the North is not immune. Finland is currently showing the fastest deterioration in debt metrics, driven by an aging population and defense investments. Meanwhile, Romania and Poland are rapidly increasing borrowing to fund military and infrastructure, though their absolute debt per capita remains low for now.
Check Your Country
The debt clock never stops ticking. Are you contributing to a surplus or a deficit right now?
Click here to view the Live EU Debt Map and select your country for real-time stats.
Further Reading
Analysis and data you might have missed

Europe’s Debt Burden in 2026: Which EU Countries Are Under the Most Pressure?
Europe’s public debt is not spread evenly. This data-backed analysis explains why total debt and debt-to-GDP tell two different stories about fiscal pressure in the EU.
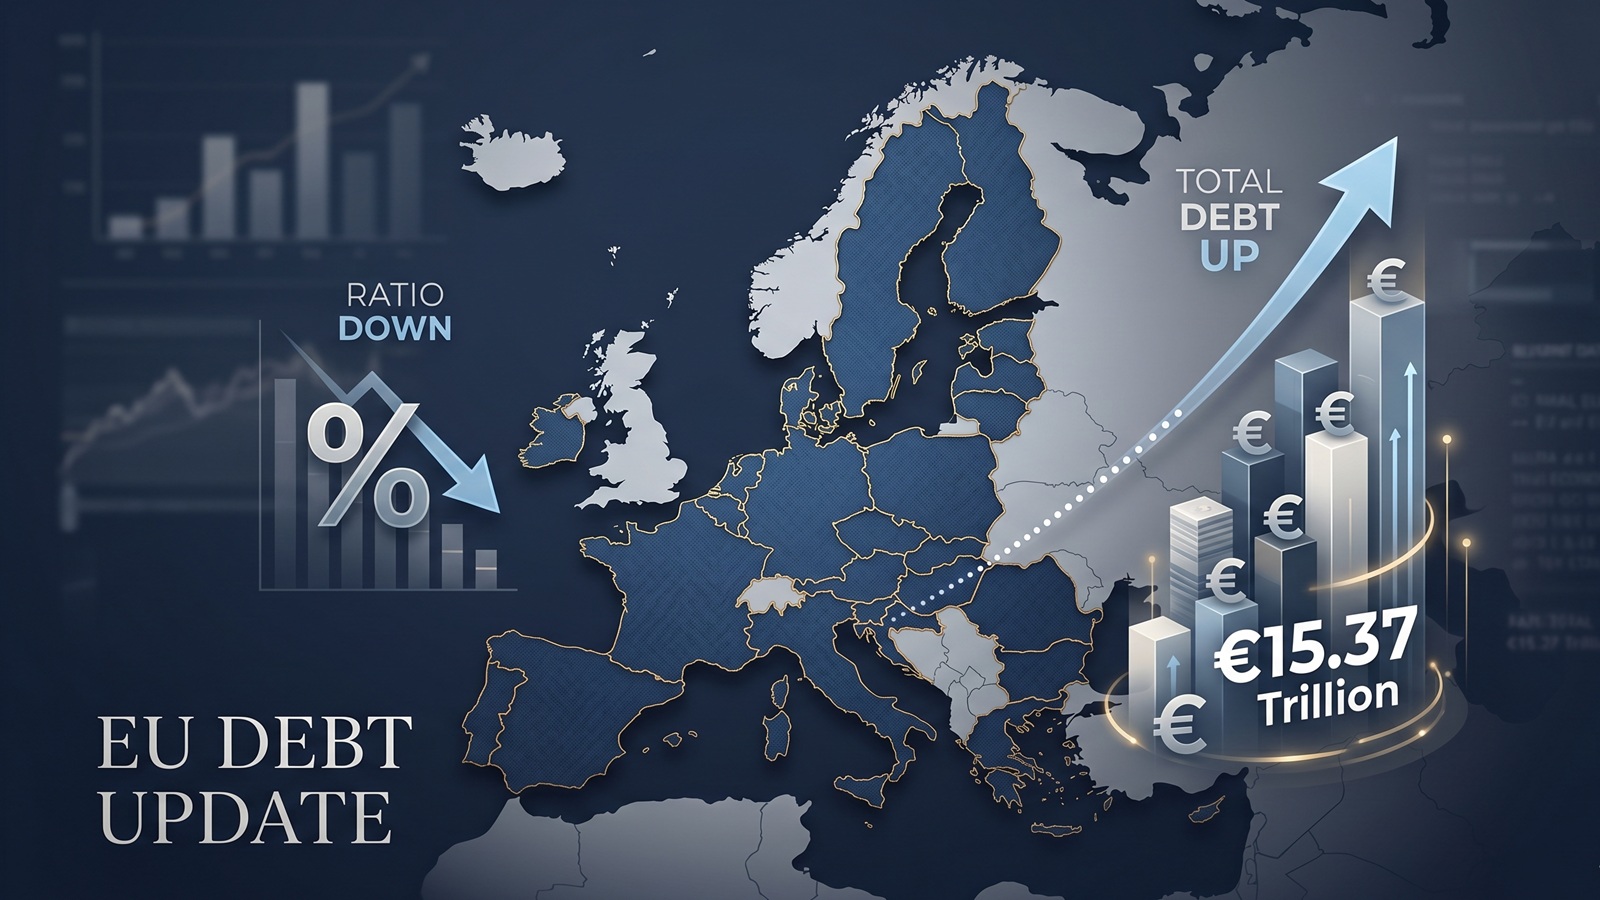
EU debt update: the ratio fell, but the pile still grew to €15.37tn
The latest Eurostat release offers a picture that looks calmer than it really is. The EU debt ratio edged down in late 2025, but the total stock of government debt still rose to more than €15.37tn.
EU Debt Explained: Why Adding It All Up Helps, and Misleads
Add together the public debt of all 27 EU countries and the total comes to more than €15 trillion. That number is useful, especially on a live map, but it can also mislead because Europe does not borrow like a single country.

Europe’s debt isn’t exploding — but something feels different in 2026
There’s no sudden debt crisis in Europe. But if you look closely, the direction is shifting. And that shift could matter more than the actual numbers.

The Dollar Dives, The Euro Thrives: A Silent Crisis for Europe's Debt Mountain?
As the Greenback stumbles, the Euro is gaining ground. While tourists cheer, Brussels holds its breath. We analyze how the shifting FX landscape threatens to rewrite the map of European sovereign debt.

The Fiscal Frontline: Can Europe Afford to Rearm While Cutting Debt?
As 2026 begins, Europe faces a paralyzing paradox: the geopolitical imperative to rearm meets the rigid reality of reinstated fiscal rules.