France’s public debt in 2025: what the numbers tell us

Key figures (simple overview)
- Total public debt: about €3.3 trillion.
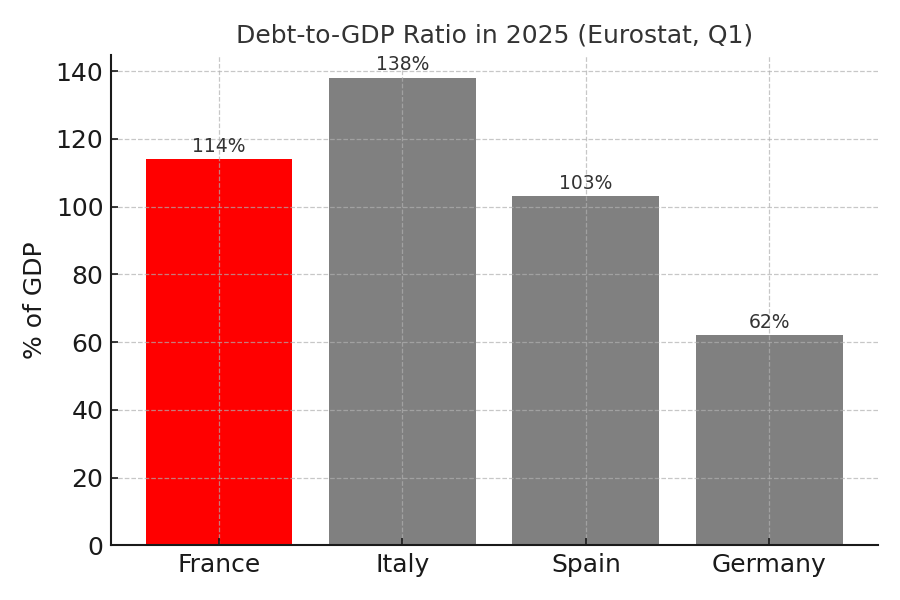
- Debt-to-GDP ratio: roughly 114% (the debt is bigger than one year of the economy).
- Budget deficit (2025): around 5.8% of GDP (EU rule is 3%).
- EU comparison: France’s debt ratio is among the highest in the EU (only Greece and Italy are higher). The euro area average is much lower.
What does “debt-to-GDP” mean?
It shows how big a country’s debt is compared to the size of its economy. If the ratio is 100%, the debt equals one year of everything the country produces. A higher number means a heavier debt burden.
Political context (why this is in the news)
- The government announced a savings plan of about €44 billion to shrink the deficit.
- One proposal (very controversial) even suggested scrapping public holidays to boost output.
- Opposition parties threatened no-confidence votes, so the government’s position is fragile.
- Public support for cutting holidays is low, and protests underline how difficult budget reforms are.
Economic risks (in plain language)
- Rising interest costs: When rates go up, borrowing becomes more expensive. France already spends tens of billions per year on interest—money that can’t go to schools or hospitals.
- Credit rating pressure: If rating agencies downgrade France, borrowing could become even more expensive.
- Investor nerves: Political fights make it harder to pass reforms, which can worry markets.
Why this matters (for France and Europe)
- France is the second-largest economy in the euro area. If France struggles, it can affect the whole region.
- EU fiscal rules say deficits should be below 3% and debt near 60%. France being far above those levels puts the credibility of the rules to the test.
- Higher French borrowing costs can push up borrowing costs in other countries too.
Trends & what to watch
- Deficit path: Can France reduce the deficit toward 3% without hurting growth?
- Reforms: Pension, spending control, and better tax collection are key—but politically hard.
- New priorities: Defense, energy support, and climate investments make cutting the deficit tougher.
FAQ
Why is France’s debt so high?
Because the government has run budget deficits for many years. Crises (like COVID-19) also pushed spending up. Interest costs and slow growth make it harder to bring debt down.
What is France’s debt-to-GDP in 2025?
About 114%. That means the total debt is larger than one year of the economy.
How does France compare to Italy?
Italy’s debt ratio is even higher (around the upper-130s % of GDP). But France’s ratio is still far above the EU target.
Will France be downgraded by rating agencies?
It’s a risk. If deficits stay high and reforms stall, borrowing could get more expensive after a downgrade.
Source: Eurostat (gov_10q_ggdebt), European Commission. This explainer uses the latest official figures available in 2025.
Further Reading
Analysis and data you might have missed

Europe’s Debt Burden in 2026: Which EU Countries Are Under the Most Pressure?
Europe’s public debt is not spread evenly. This data-backed analysis explains why total debt and debt-to-GDP tell two different stories about fiscal pressure in the EU.
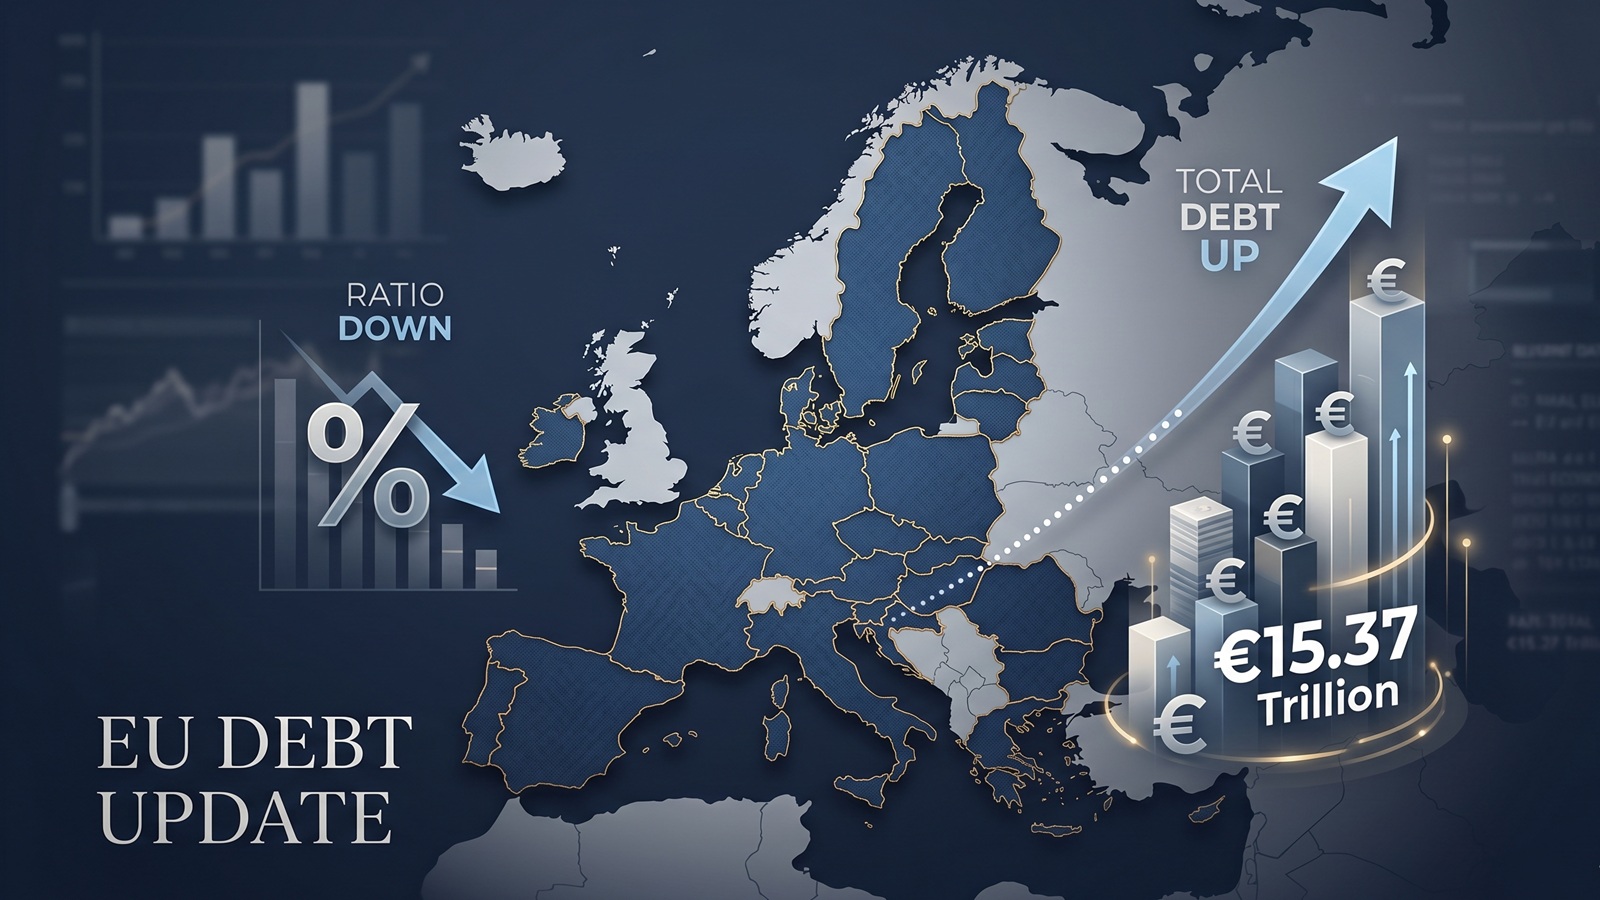
EU debt update: the ratio fell, but the pile still grew to €15.37tn
The latest Eurostat release offers a picture that looks calmer than it really is. The EU debt ratio edged down in late 2025, but the total stock of government debt still rose to more than €15.37tn.

EU Debt Explained: Why Adding It All Up Helps, and Misleads
Add together the public debt of all 27 EU countries and the total comes to more than €15 trillion. That number is useful, especially on a live map, but it can also mislead because Europe does not borrow like a single country.

Europe’s debt isn’t exploding — but something feels different in 2026
There’s no sudden debt crisis in Europe. But if you look closely, the direction is shifting. And that shift could matter more than the actual numbers.

The Dollar Dives, The Euro Thrives: A Silent Crisis for Europe's Debt Mountain?
As the Greenback stumbles, the Euro is gaining ground. While tourists cheer, Brussels holds its breath. We analyze how the shifting FX landscape threatens to rewrite the map of European sovereign debt.

Born with a €58,000 Mortgage? The 2026 Debt-per-Capita Map of Europe
New 2026 projections reveal a massive financial divide. While a Dutch citizen needs 9 months of work to pay off their share of the national debt, an Italian needs over 2 years.