Live EU Government Debt Map
If you added together every euro of public debt from all 27 EU countries, you’d get the number shown below, a live, ticking estimate that never stands still.
The EU Debt Map visualizes the combined national debts of the European Union in real time. Each country’s most recent Eurostat data point is used as a baseline, then projected second by second to show how fast public debt continues to grow (or, in rare cases, shrink). This isn’t just a statistic, it’s a pulse of Europe’s financial health. Whether you’re comparing France to Germany, tracking Italy’s debt ratio, or exploring smaller economies like Estonia and Malta, this map translates complex fiscal data into an intuitive visual that updates every second.
Source: Eurostat (gov_10q_ggdebt). Educational visualization, not an official statistic.
EU overview
EU debt explained in simple terms
This EU Debt Map shows the national debt of all EU-27 countries in real time. Using Eurostat as a baseline, each country’s latest official figure is extrapolated per second to create a live, ticking estimate. Click any country to drill into its numbers and see whether debt is rising or falling. This is an educational visualization—not an official statistic.
Highlights
Government debt shapes interest rates, inflation, fiscal policy, and the broader EU economy. These live tickers surface the biggest movements at a glance.
Quick list
- 🇦🇹 Austria — ↓ falling
- 🇧🇪 Belgium — ↑ rising
- 🇧🇬 Bulgaria — ↑ rising
- 🇭🇷 Croatia — ↑ rising
- 🇨🇾 Cyprus — ↓ falling
- 🇨🇿 Czechia — ↑ rising
- 🇩🇰 Denmark — ↓ falling
- 🇪🇪 Estonia — ↓ falling
- 🇫🇮 Finland — ↑ rising
- 🇫🇷 France — ↑ rising
- 🇩🇪 Germany — ↑ rising
- 🇬🇷 Greece — ↑ rising
- 🇭🇺 Hungary — ↑ rising
- 🇮🇪 Ireland — ↑ rising
- 🇮🇹 Italy — ↑ rising
- 🇱🇻 Latvia — ↑ rising
- 🇱🇹 Lithuania — ↓ falling
- 🇱🇺 Luxembourg — ↓ falling
- 🇲🇹 Malta — ↑ rising
- 🇳🇱 Netherlands — ↑ rising
- 🇵🇱 Poland — ↑ rising
- 🇵🇹 Portugal — ↑ rising
- 🇷🇴 Romania — ↑ rising
- 🇸🇰 Slovakia — ↑ rising
- 🇸🇮 Slovenia — ↑ rising
- 🇪🇸 Spain — ↑ rising
- 🇸🇪 Sweden — ↓ falling
Latest articles
View all →
Born with a €58,000 Mortgage? The 2026 Debt-per-Capita Map of Europe
New 2026 projections reveal a massive financial divide. While a Dutch citizen needs 9 months of work to pay off their share of the national debt, an Italian needs over 2 years.
Read more →
The Fiscal Frontline: Can Europe Afford to Rearm While Cutting Debt?
As 2026 begins, Europe faces a paralyzing paradox: the geopolitical imperative to rearm meets the rigid reality of reinstated fiscal rules.
Read more →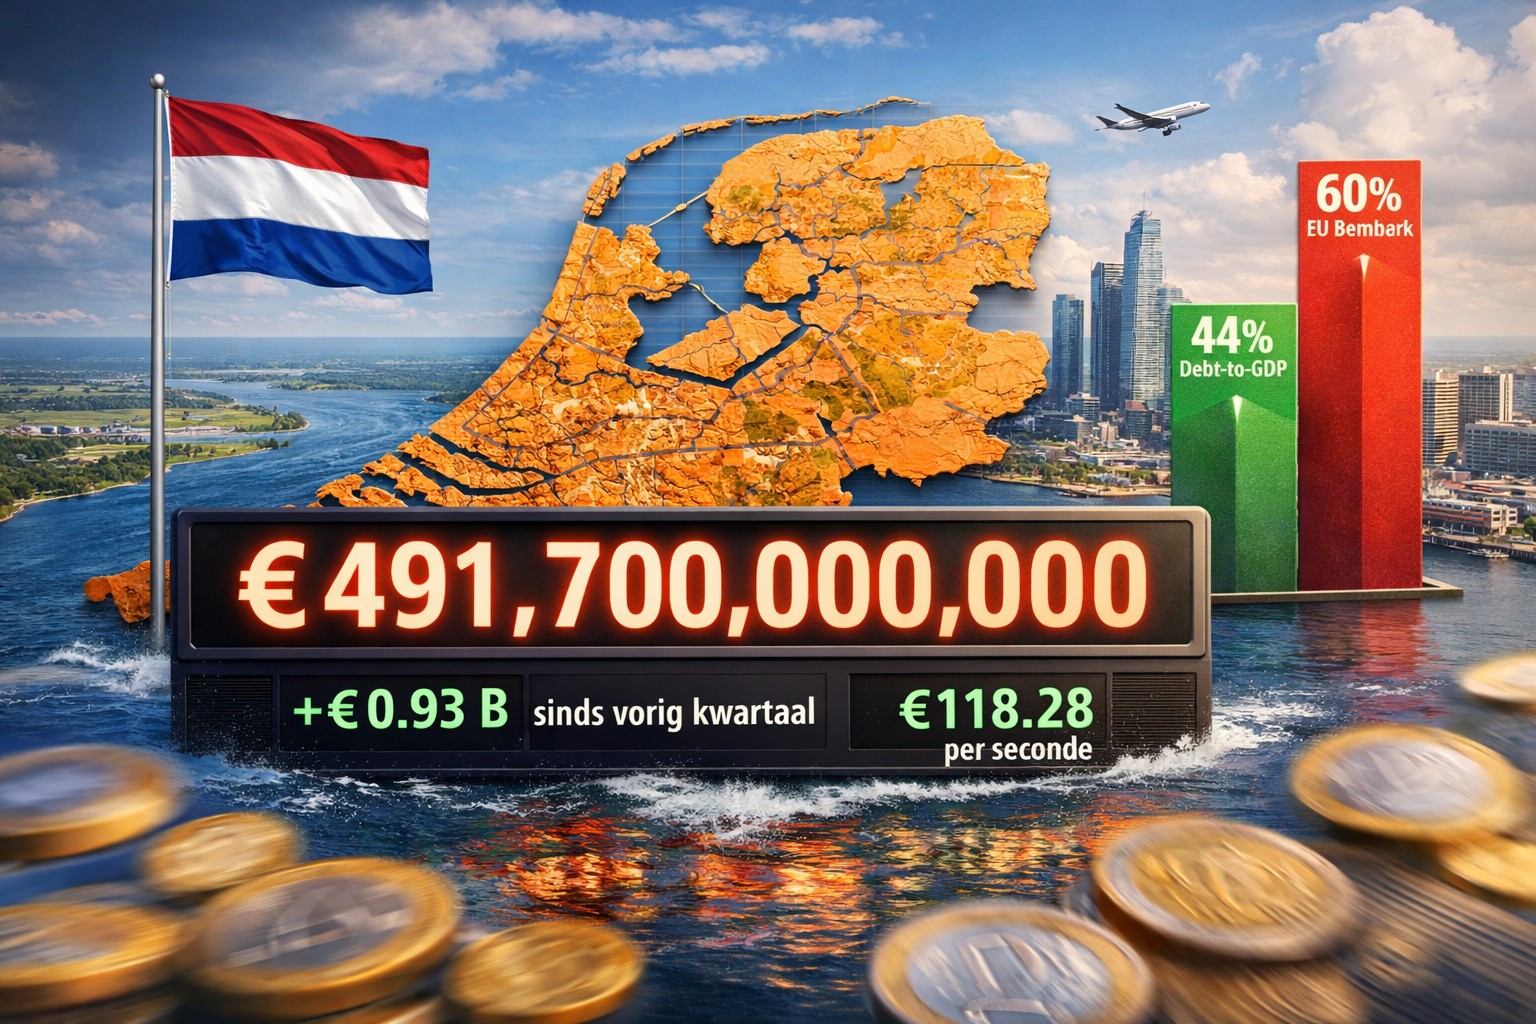
Netherlands National Debt in 2025: What the Live Counter Shows (and What It Means)
EU Debt Map visualizes the Netherlands’ public debt as a real-time estimate derived from Eurostat. This article explains what the live number, the €-per-second pace, and the debt-to-GDP context mean—and how to interpret them responsibly.
Read more →FAQ: EU government debt
How is the live estimate calculated?
We interpolate between the last two Eurostat reference periods and extrapolate per second. Country pages include the baseline and trend indicator.
Is this an official statistic?
No. It’s an educational visualization based on official data to improve understanding and spark discussion.