Europe’s debt isn’t exploding — but something feels different in 2026

No sudden crisis — but a gradual shift
At first glance, Europe’s government debt does not appear alarming in 2026. There is no sharp spike in the aggregate numbers, no sudden deterioration that would justify dramatic headlines. The overall picture still looks relatively stable compared to the turbulence of previous years.
And yet, when you look beyond the surface, the direction of travel is beginning to shift. The change is subtle, but it is visible in the data. Debt levels are no longer moving in a broadly unified pattern across the European Union. Some countries are managing to stabilize their positions, while others are edging upward again. Not dramatically, but consistently.
The average tells only part of the story
The EU-wide average debt-to-GDP ratio remains the most frequently cited figure in discussions about fiscal stability. But averages smooth out differences, and in doing so they can obscure important developments.
What stands out in 2026 is not the overall level, but the widening dispersion between countries. Fiscal trajectories are increasingly diverging. While certain governments are gradually improving their balance sheets, others continue to rely heavily on borrowing to maintain spending levels. That divergence does not produce immediate instability, but it alters the structural balance within the European economy.
The interest rate environment has changed the equation
For much of the past decade, low interest rates reduced the urgency of debt concerns. Governments could refinance at minimal cost, and high debt ratios were manageable as long as borrowing remained inexpensive.
That backdrop has changed. With interest rates higher than in the years following the financial crisis and the pandemic, the cost of carrying debt has become more significant. This does not trigger an immediate crisis, but it introduces persistent pressure. Budgets become less flexible. Policy choices narrow. Countries with already elevated debt levels feel this constraint more acutely.
A quiet divergence within Europe
What makes the current moment noteworthy is not a dramatic surge in debt, but the growing separation between stronger and weaker fiscal positions. Europe is no longer moving as a single bloc in terms of public finances. The differences are becoming more pronounced.
Historically, fiscal stress rarely begins with a sudden collapse. More often, it develops through gradual divergence — a slow accumulation of imbalance that only becomes visible in hindsight. The present shift may not be alarming, but it is meaningful.
Direction matters more than the level
Debt, in isolation, is simply a number. Its trajectory is what determines sustainability. If borrowing continues to outpace economic growth in certain countries, the long-term adjustment required to stabilize those ratios becomes increasingly demanding.
The question in 2026 is therefore less about whether Europe faces an immediate debt crisis, and more about whether the current paths are converging toward stability or drifting further apart.
Explore the data behind the shift
The clearest way to understand these developments is to compare countries directly and observe how their debt-to-GDP ratios evolve over time. The differences, rather than the average, reveal where pressures may build.
Further Reading
Analysis and data you might have missed

Europe’s Debt Burden in 2026: Which EU Countries Are Under the Most Pressure?
Europe’s public debt is not spread evenly. This data-backed analysis explains why total debt and debt-to-GDP tell two different stories about fiscal pressure in the EU.
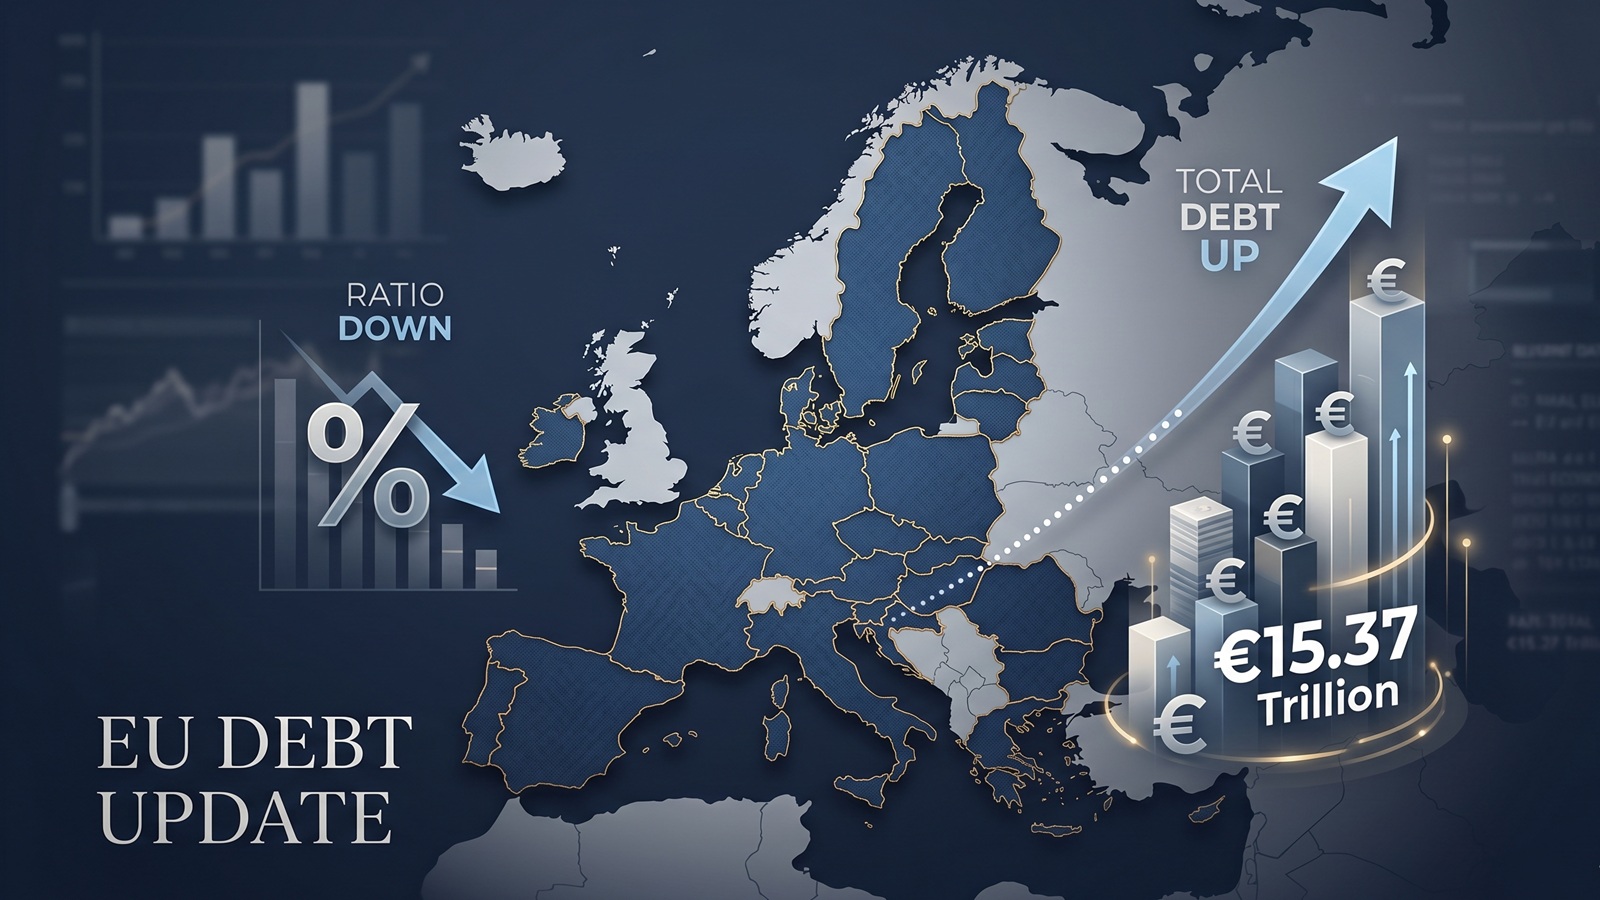
EU debt update: the ratio fell, but the pile still grew to €15.37tn
The latest Eurostat release offers a picture that looks calmer than it really is. The EU debt ratio edged down in late 2025, but the total stock of government debt still rose to more than €15.37tn.

EU Debt Explained: Why Adding It All Up Helps, and Misleads
Add together the public debt of all 27 EU countries and the total comes to more than €15 trillion. That number is useful, especially on a live map, but it can also mislead because Europe does not borrow like a single country.

The Dollar Dives, The Euro Thrives: A Silent Crisis for Europe's Debt Mountain?
As the Greenback stumbles, the Euro is gaining ground. While tourists cheer, Brussels holds its breath. We analyze how the shifting FX landscape threatens to rewrite the map of European sovereign debt.

Born with a €58,000 Mortgage? The 2026 Debt-per-Capita Map of Europe
New 2026 projections reveal a massive financial divide. While a Dutch citizen needs 9 months of work to pay off their share of the national debt, an Italian needs over 2 years.

The Fiscal Frontline: Can Europe Afford to Rearm While Cutting Debt?
As 2026 begins, Europe faces a paralyzing paradox: the geopolitical imperative to rearm meets the rigid reality of reinstated fiscal rules.