Debt-to-GDP Ratios of EU Countries in 2025

What is Debt-to-GDP?
The debt-to-GDP ratio shows how much money a country owes compared to the size of its economy. If the ratio is 100%, the country owes the same as it produces in one year. A higher number means a heavier debt burden, while a lower number shows a lighter debt load. This measure is often used to compare the financial health of countries.
EU averages in 2025
At the start of 2025, government debt in the European Union was about 82% of GDP. In the euro area (the 20 countries using the euro), the average was even higher, around 88%. EU rules suggest debt should stay below 60%, but more than half of the member states are above this level.
Ranking of EU countries (Q1 2025)
Here is the ranking of all 27 EU countries by their debt-to-GDP ratio in the first quarter of 2025:
| Country | Debt-to-GDP (%) | Change vs end-2024 |
|---|---|---|
| Greece | 152.5 | -1.1 |
| Italy | 137.9 | +2.5 |
| France | 114.1 | +0.9 |
| Belgium | 106.8 | +2.1 |
| Spain | 103.5 | +1.6 |
| Portugal | 96.4 | +1.5 |
| Austria | 84.9 | +3.5 |
| Finland | 83.7 | +1.6 |
| Hungary | 75.3 | +1.8 |
| Slovenia | 69.9 | +2.9 |
| Cyprus | 64.3 | -0.8 |
| Slovakia | 62.8 | +3.5 |
| Germany | 62.3 | -0.1 |
| Croatia | 58.4 | +0.8 |
| Poland | 57.4 | +2.2 |
| Romania | 55.8 | +1.0 |
| Malta | 48.1 | +0.7 |
| Latvia | 45.6 | -1.2 |
| Czechia | 43.4 | 0.0 |
| Netherlands | 43.2 | -0.6 |
| Lithuania | 40.6 | +2.4 |
| Ireland | 34.9 | -3.7 |
| Sweden | 33.5 | -0.4 |
| Denmark | 29.9 | -0.6 |
| Luxembourg | 26.1 | -0.2 |
| Estonia | 24.1 | +0.5 |
| Bulgaria | 23.9 | -0.2 |
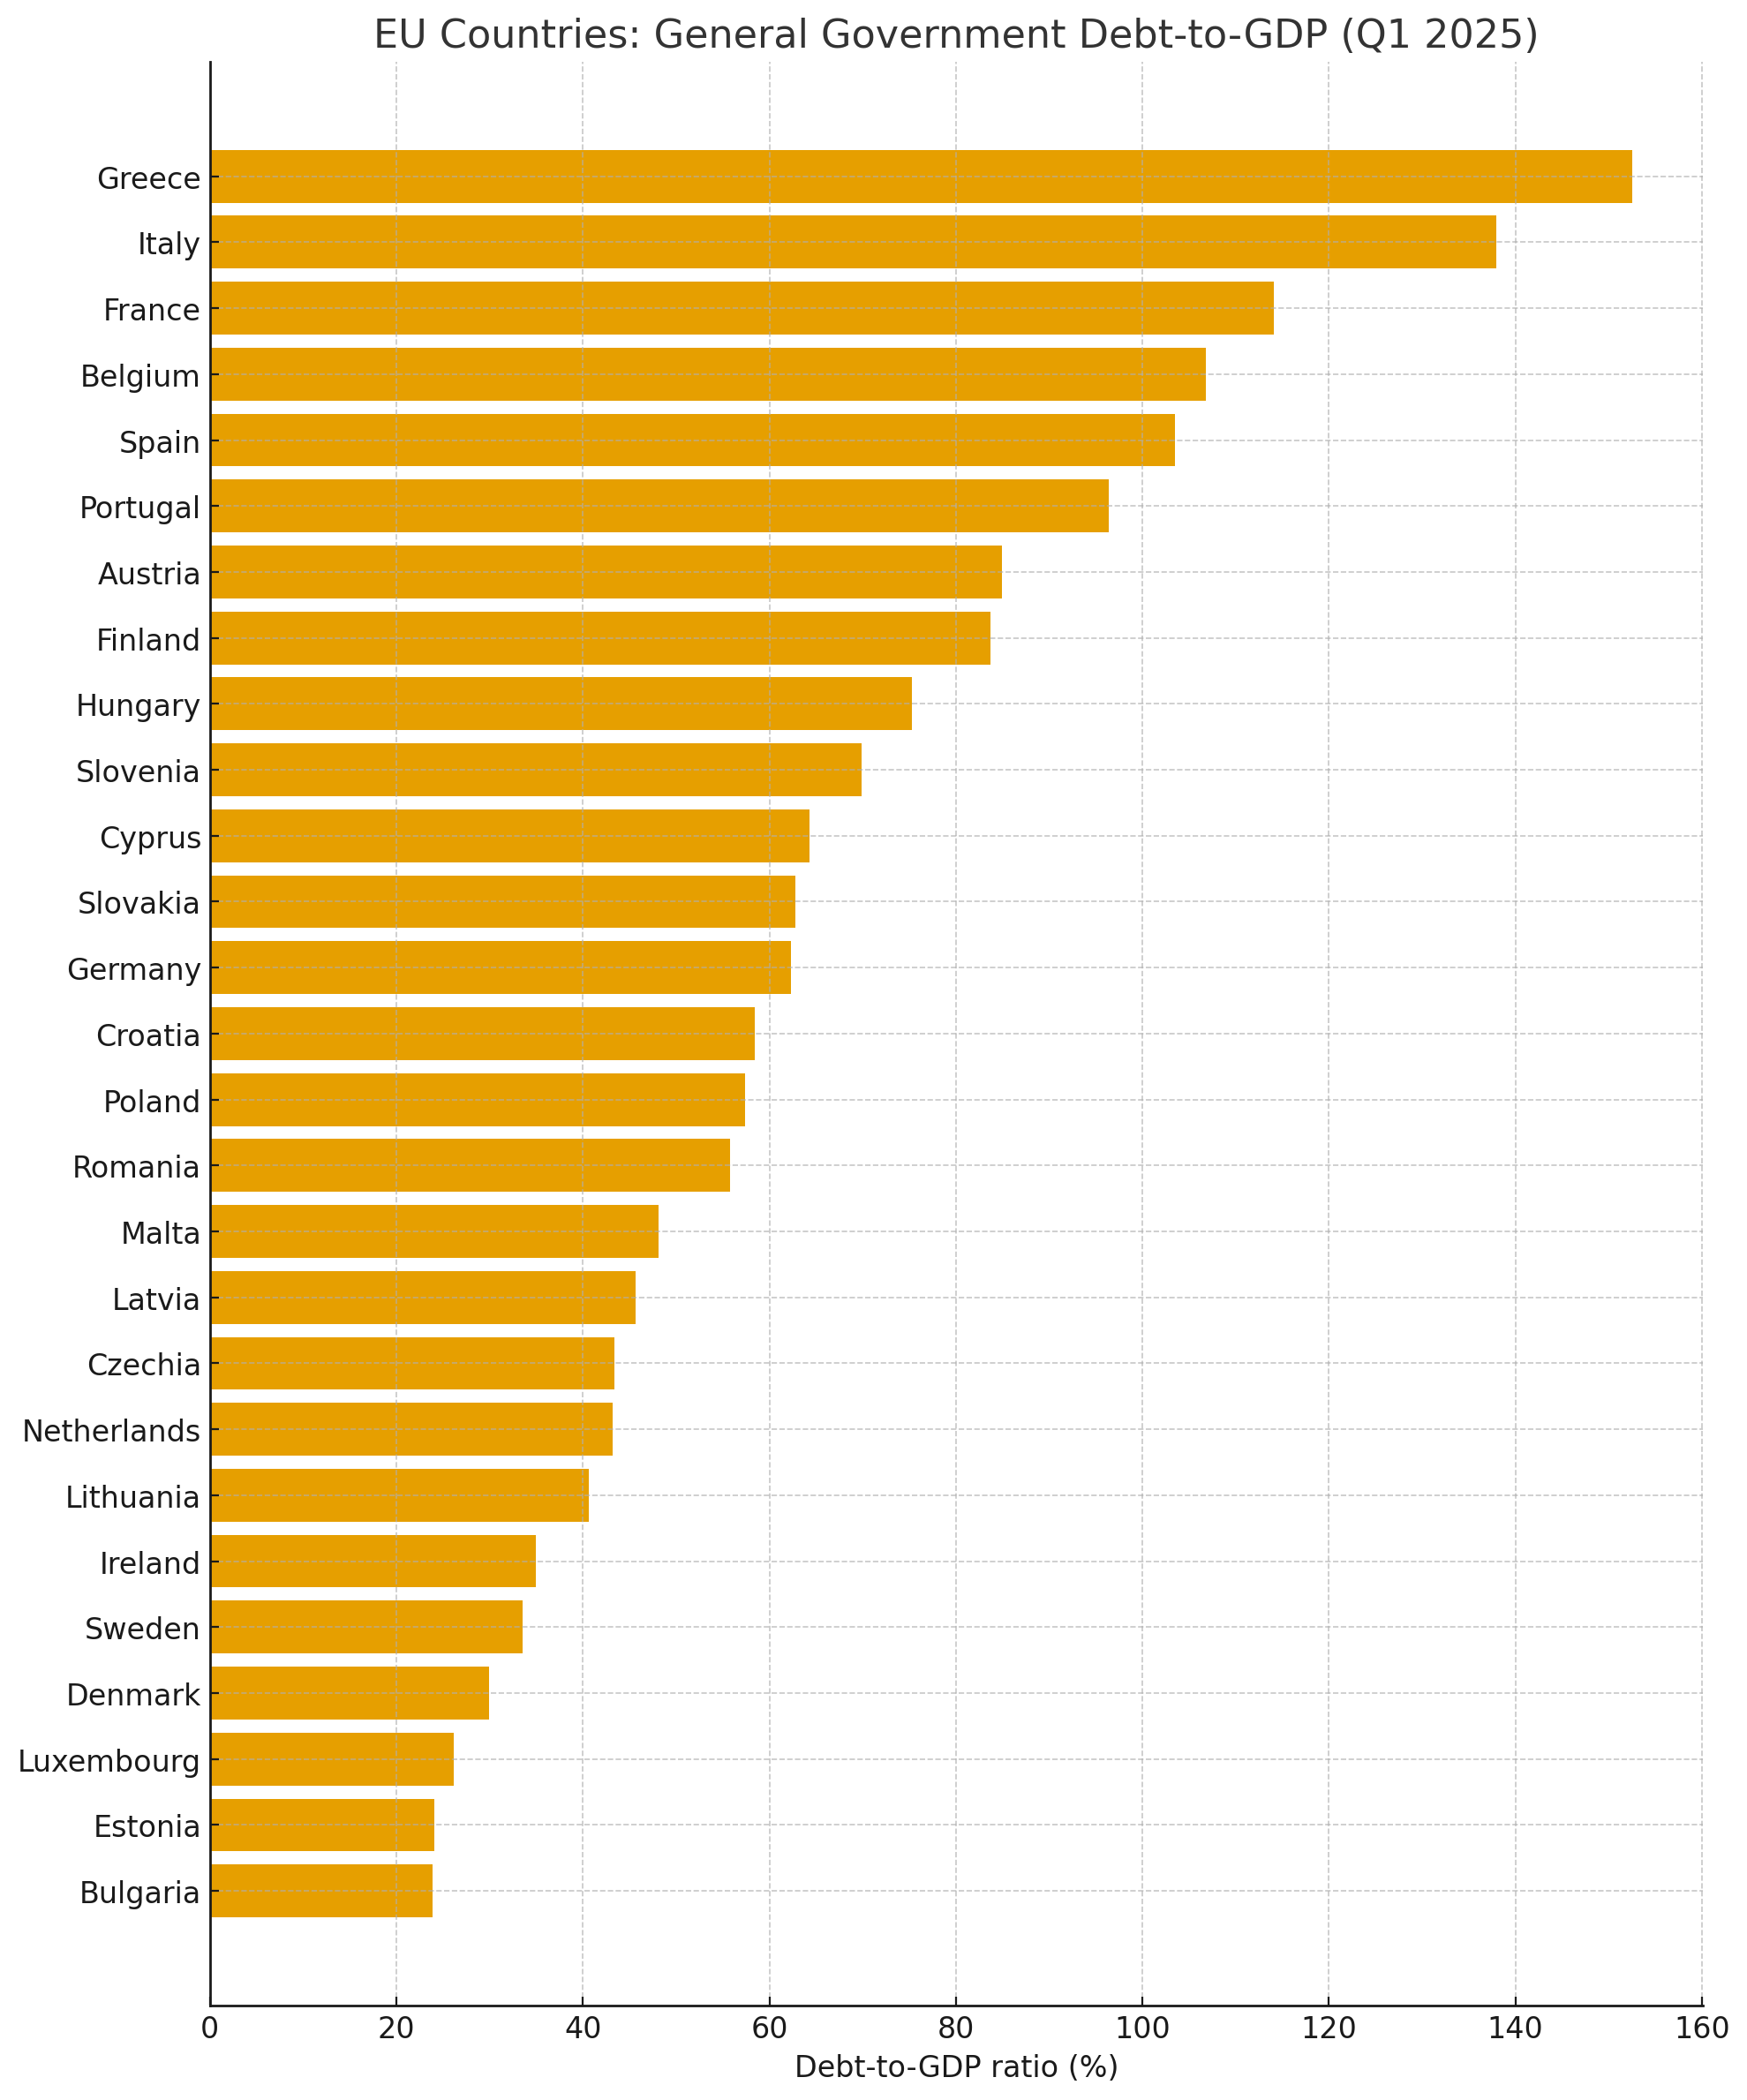
Source: Eurostat (gov_10q_ggdebt, Q1 2025)
Top and bottom countries
Highest debt: Greece (152.5%), Italy (137.9%), France (114.1%). These countries carry very heavy debt burdens and are closely watched by financial markets.
Lowest debt: Bulgaria (23.9%), Estonia (24.1%), Luxembourg (26.1%). These countries have strong finances and plenty of room to borrow if needed.
Regional patterns
There is a clear North–South divide in Europe. Southern countries like Greece, Italy, Spain and Portugal have much higher debt. Northern and Eastern countries such as Denmark, Sweden, Estonia and Bulgaria keep debt much lower. Still, there are exceptions: Finland in the north has debt above 80%, while Portugal has managed to cut its debt in recent years.
Why debt levels change
Several key factors explain why some countries’ debt goes up and others’ goes down:
- Economic growth: If GDP grows fast, the ratio usually goes down, even if debt stays the same.
- Inflation: Rising prices increase GDP in money terms, making debt look smaller compared to the economy.
- Government spending: Countries with big budget deficits (spending more than they earn) see debt rise quickly.
- Interest costs: Higher interest rates make debt more expensive to service, especially for high-debt countries like Italy.
Recent changes since 2024
Between early 2024 and early 2025:
- Biggest improvements: Greece (–9.3 points), Cyprus (–8.2), Ireland (–6.1).
- Biggest increases: Poland (+6.1), Finland (+5.1), Austria (+3.5).
This shows that some countries are making progress, while others are still struggling.
Why it matters
High public debt is not just a number. It affects what governments can spend on services like healthcare, education, and infrastructure. It also matters for the stability of the euro area: if a large country like Italy faces debt trouble, it could affect all of Europe. That’s why the EU keeps close watch on these figures.
FAQ
Which EU country has the highest debt in 2025?
Greece, with 152.5% of GDP.
Which country has the lowest debt?
Bulgaria, with just 23.9% of GDP.
What is the EU rule for debt?
The Stability and Growth Pact sets a limit of 60% of GDP. Most EU countries are above this level in 2025.
Has EU debt improved since COVID-19?
Yes, the EU average debt ratio has fallen from about 90% in 2020 to around 82% in 2025. But progress is uneven, with some countries reducing debt fast and others still going up.
Source: Eurostat (gov_10q_ggdebt, Q1 2025), European Commission.
Further Reading
Analysis and data you might have missed

Europe’s Debt Burden in 2026: Which EU Countries Are Under the Most Pressure?
Europe’s public debt is not spread evenly. This data-backed analysis explains why total debt and debt-to-GDP tell two different stories about fiscal pressure in the EU.
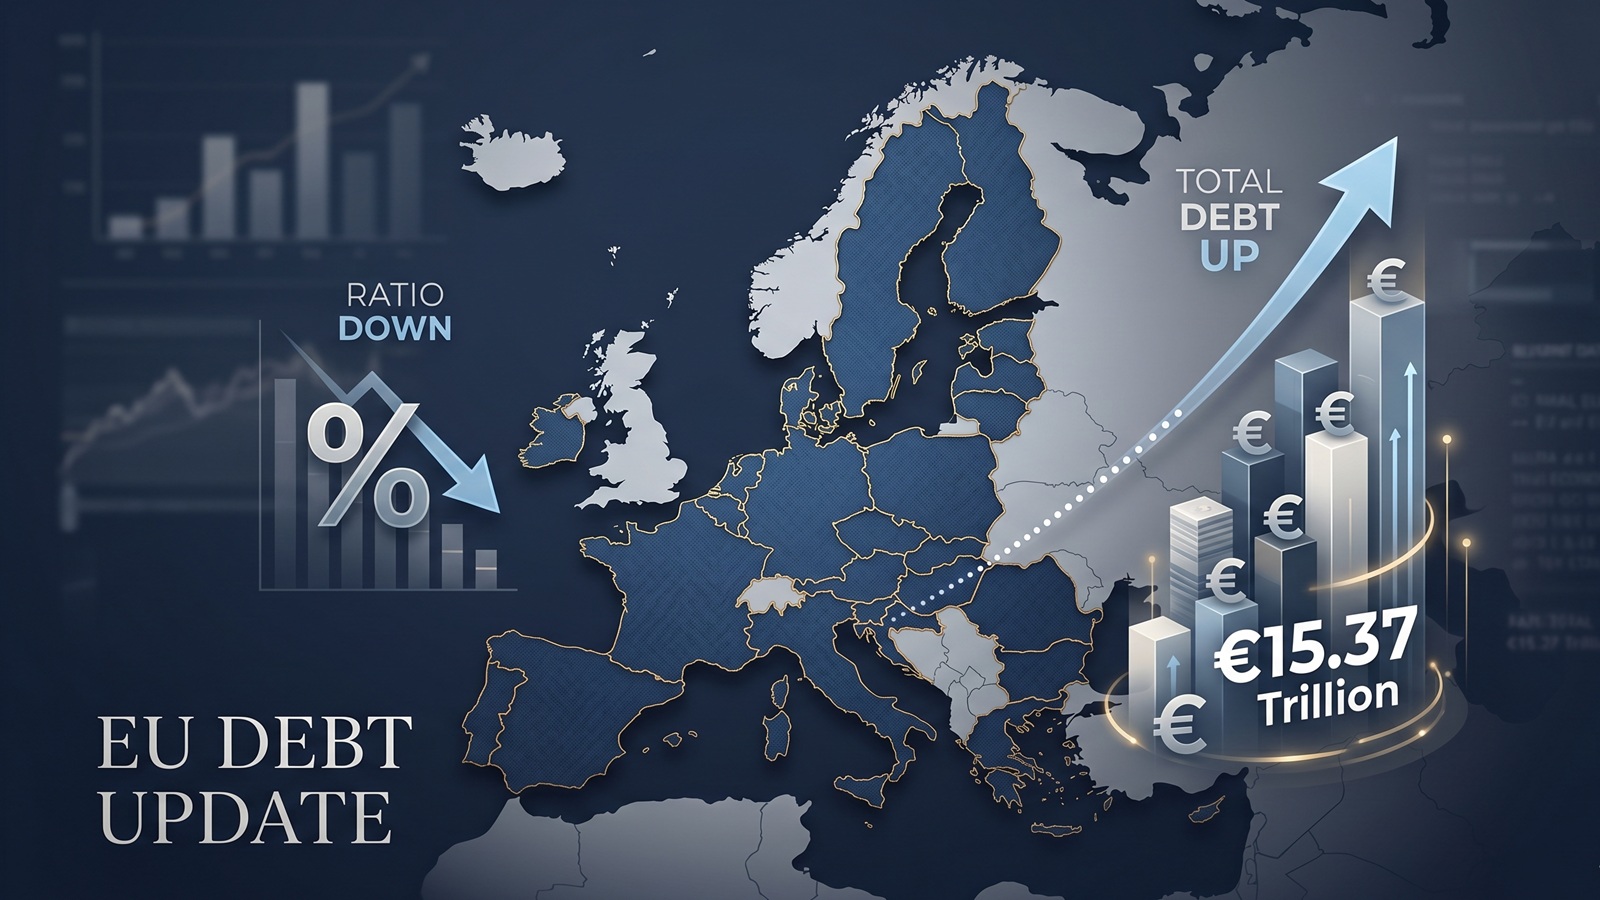
EU debt update: the ratio fell, but the pile still grew to €15.37tn
The latest Eurostat release offers a picture that looks calmer than it really is. The EU debt ratio edged down in late 2025, but the total stock of government debt still rose to more than €15.37tn.

EU Debt Explained: Why Adding It All Up Helps, and Misleads
Add together the public debt of all 27 EU countries and the total comes to more than €15 trillion. That number is useful, especially on a live map, but it can also mislead because Europe does not borrow like a single country.

Europe’s debt isn’t exploding — but something feels different in 2026
There’s no sudden debt crisis in Europe. But if you look closely, the direction is shifting. And that shift could matter more than the actual numbers.

The Dollar Dives, The Euro Thrives: A Silent Crisis for Europe's Debt Mountain?
As the Greenback stumbles, the Euro is gaining ground. While tourists cheer, Brussels holds its breath. We analyze how the shifting FX landscape threatens to rewrite the map of European sovereign debt.

Born with a €58,000 Mortgage? The 2026 Debt-per-Capita Map of Europe
New 2026 projections reveal a massive financial divide. While a Dutch citizen needs 9 months of work to pay off their share of the national debt, an Italian needs over 2 years.