Europe’s Debt Burden in 2026: Which EU Countries Are Under the Most Pressure?

Europe’s debt burden is not spread evenly. Some countries owe more money in absolute terms, while others face heavier pressure because their debt is large compared with the size of their economy.
That difference matters. A large economy can carry a large amount of debt more easily than a smaller or slower-growing economy. This is why total government debt and debt-to-GDP often tell two different stories.
Key takeaways
- The EU government debt-to-GDP ratio stood at 81.7% at the end of 2025, according to Eurostat.
- The euro area ratio was higher, at 87.8%.
- The highest debt-to-GDP ratios were recorded in Greece, Italy, France, Belgium and Spain.
- France had the largest absolute debt stock in the EU, but Greece and Italy still carried heavier debt burdens relative to GDP.
- The next Eurostat quarterly government debt update is scheduled for 21 July 2026.
Europe’s debt picture in 2026
Eurostat’s latest quarterly government debt release shows that public debt remains one of Europe’s most uneven economic pressures. At the end of the fourth quarter of 2025, the EU debt-to-GDP ratio stood at 81.7%, while the euro area stood at 87.8%.
Compared with the end of 2024, both ratios moved higher. The EU ratio rose from 80.7% to 81.7%, while the euro area rose from 87.0% to 87.8%. That does not mean every country moved in the same direction. Some countries reduced their debt ratio, while others saw it rise sharply.
This is why the live EU debt map is useful as a starting point, but the deeper story comes from comparing several measures at once.
Total debt shows scale, not pressure
In absolute euro terms, the largest debt stocks are found in Europe’s biggest economies. France recorded around €3.46 trillion in general government gross debt at the end of 2025. Italy followed with around €3.10 trillion, Germany with around €2.84 trillion and Spain with around €1.70 trillion.
Those numbers are huge, but they do not automatically tell us which country is under the most fiscal pressure. Germany’s total debt is very large, yet its debt-to-GDP ratio was 63.5% at the end of 2025. France’s ratio was much higher, at 115.6%.
This is the central point: the biggest debt is not always the biggest burden.
Debt-to-GDP tells the pressure story
Debt-to-GDP compares government debt with the size of the economy. It is not a perfect measure, but it helps show whether a country’s debt is large relative to its economic base.
At the end of 2025, the highest debt-to-GDP ratios in the EU were recorded in Greece at 146.1%, Italy at 137.1%, France at 115.6%, Belgium at 107.9% and Spain at 100.7%.
That ranking changes the story. France has the largest absolute debt stock, but Greece and Italy still carry heavier debt burdens relative to GDP. Belgium also stands out because its ratio is above 100%, even though its economy is much smaller than France, Germany, Italy or Spain.
The countries under the most pressure
Greece still had the highest debt-to-GDP ratio in the EU at the end of 2025, but its ratio fell significantly compared with the previous year. That makes Greece a special case: the debt burden is still very high, but the direction has improved.
Italy remains one of the most important countries to watch. Its debt ratio was 137.1%, and because Italy is one of the euro area’s largest economies, changes in Italian public debt matter far beyond Italy itself.
France stands out because it combines a very large absolute debt stock with a debt-to-GDP ratio above 115%. It also recorded one of the larger annual increases among EU countries, rising by 2.9 percentage points compared with the end of 2024.
Belgium is smaller in absolute terms, but its debt ratio rose to 107.9%. That puts it firmly among the EU countries with the highest debt burden relative to economic output.
Spain remained just above the 100% mark at the end of 2025. Its ratio declined compared with the previous quarter and the previous year, but the level is still high enough to keep Spain in the top group.
Which countries are moving in the wrong direction?
The level of debt matters, but the direction matters too. Compared with the end of 2024, the largest increases in debt-to-GDP were recorded in Finland, Bulgaria, Poland, Romania, Belgium, France and Italy.
That does not mean all of these countries are in the same position. Bulgaria’s ratio remained below 30%, while Belgium, France and Italy were already above the EU’s 60% reference value. A rising ratio is more concerning when it starts from a high level.
On the other side, Greece, Cyprus, Ireland, Portugal and Denmark recorded the largest annual decreases in their debt ratios. Greece is still highly indebted, but its downward movement is important because it shows that a very high ratio can improve when growth, fiscal balances and debt dynamics move in the right direction.
Why the 60% threshold still matters
The EU’s fiscal framework has long used a 60% debt-to-GDP reference value. This does not mean a country immediately faces a crisis above 60%, and it does not mean every country below 60% is risk-free.
But the threshold is useful because it gives readers a simple benchmark. Countries far above 60% usually have less room to respond to future shocks, especially if interest costs rise, growth slows or deficits remain high.
You can compare the latest country ratios on the EU debt-to-GDP ranking.
What could change next?
The next Eurostat quarterly government debt update is scheduled for 21 July 2026. That release will show whether the small decline from the third to the fourth quarter of 2025 continued into the new year.
Three things are worth watching. First, whether high-debt countries can keep their debt ratios stable or falling. Second, whether countries with fast-rising ratios can slow the increase. Third, whether deficits remain large enough to push debt higher again.
Eurostat’s annual deficit and debt release showed that the EU government deficit was 3.1% of GDP in 2025, while the euro area deficit was 2.9%. Persistent deficits make it harder to reduce debt ratios, especially when borrowing costs are no longer near zero.
How EU Debt Map estimates live debt
EU Debt Map is based on official Eurostat data. The live counters on the site estimate how debt may be moving between official releases by using recent changes in published debt figures.
Those live figures are estimates. They are not official real-time government debt numbers. The official reference point remains Eurostat’s published quarterly and annual data.
You can read more about the calculation approach on the EU Debt Map methodology page.
The bottom line
Europe does not have one single debt story. It has several. France shows the scale of absolute debt. Greece and Italy show the weight of very high debt-to-GDP ratios. Belgium shows how a smaller economy can still face serious pressure. Spain shows how a high ratio can improve, but remain important.
The most useful way to understand Europe’s debt burden is to look at both sides together: how much a country owes, and how large that debt is compared with the economy behind it.
Sources and methodology
This article is based on Eurostat’s quarterly government debt release for the fourth quarter of 2025, published on 22 April 2026, and Eurostat’s 2025 deficit and debt notification. EU Debt Map uses official Eurostat data as the base for its live debt estimates.
Further Reading
Analysis and data you might have missed
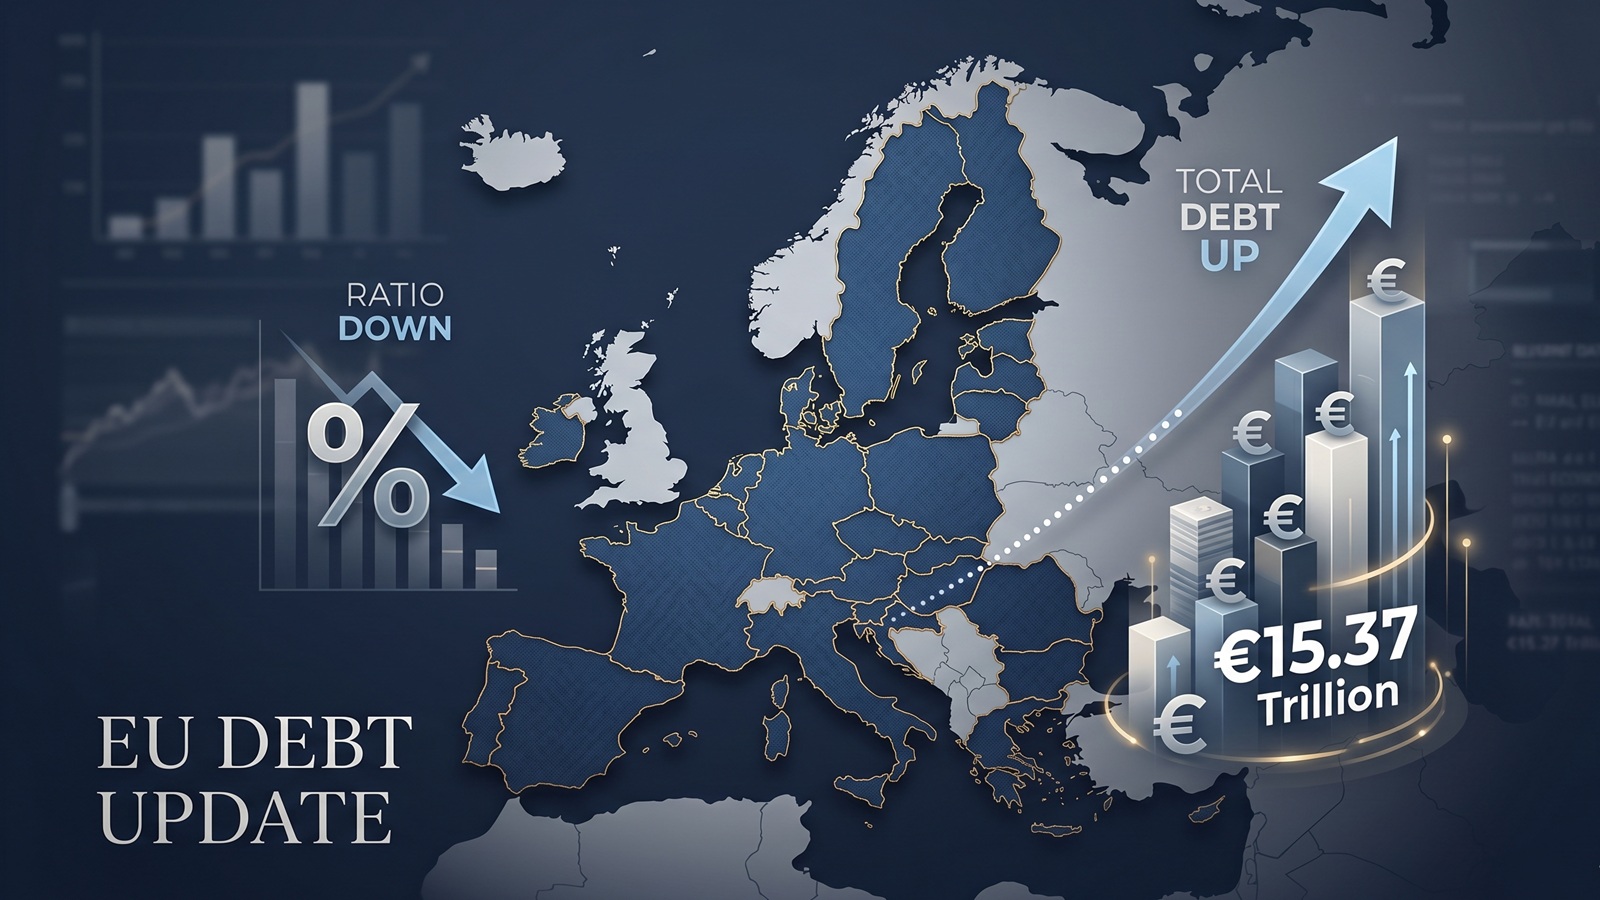
EU debt update: the ratio fell, but the pile still grew to €15.37tn
The latest Eurostat release offers a picture that looks calmer than it really is. The EU debt ratio edged down in late 2025, but the total stock of government debt still rose to more than €15.37tn.

EU Debt Explained: Why Adding It All Up Helps, and Misleads
Add together the public debt of all 27 EU countries and the total comes to more than €15 trillion. That number is useful, especially on a live map, but it can also mislead because Europe does not borrow like a single country.

Europe’s debt isn’t exploding — but something feels different in 2026
There’s no sudden debt crisis in Europe. But if you look closely, the direction is shifting. And that shift could matter more than the actual numbers.

The Dollar Dives, The Euro Thrives: A Silent Crisis for Europe's Debt Mountain?
As the Greenback stumbles, the Euro is gaining ground. While tourists cheer, Brussels holds its breath. We analyze how the shifting FX landscape threatens to rewrite the map of European sovereign debt.

Born with a €58,000 Mortgage? The 2026 Debt-per-Capita Map of Europe
New 2026 projections reveal a massive financial divide. While a Dutch citizen needs 9 months of work to pay off their share of the national debt, an Italian needs over 2 years.

The Fiscal Frontline: Can Europe Afford to Rearm While Cutting Debt?
As 2026 begins, Europe faces a paralyzing paradox: the geopolitical imperative to rearm meets the rigid reality of reinstated fiscal rules.